If you had invested $100 in each of the 59 tokens newly listed on Upbit's KRW pair in 2025, your portfolio would be worth roughly $0.31 per dollar as of March 11, 2026. Bithumb (144 tokens) shows the same figure at $0.31, and Binance (92 tokens) comes in at $0.29. All three exchanges delivered approximately 70% losses.
Of Upbit's 59 tokens, only two ended in profit: KITE (+232.8%) and BARD (+9.3%). Bithumb fared only marginally better, with just 8 out of 144 tokens in the green. The median ROI was -80.9% for Upbit and -82.1% for Bithumb.
The average ROI of the 50 tokens listed on both major Korean exchanges (-69.4%) was virtually identical to that of the 94 tokens listed exclusively on Bithumb (-68.9%). This suggests that being listed on multiple major exchanges offers no guarantee of subsequent price performance.
This analysis was inspired by a chart posted today by Messari research analyst @Degenerate_DeFi.
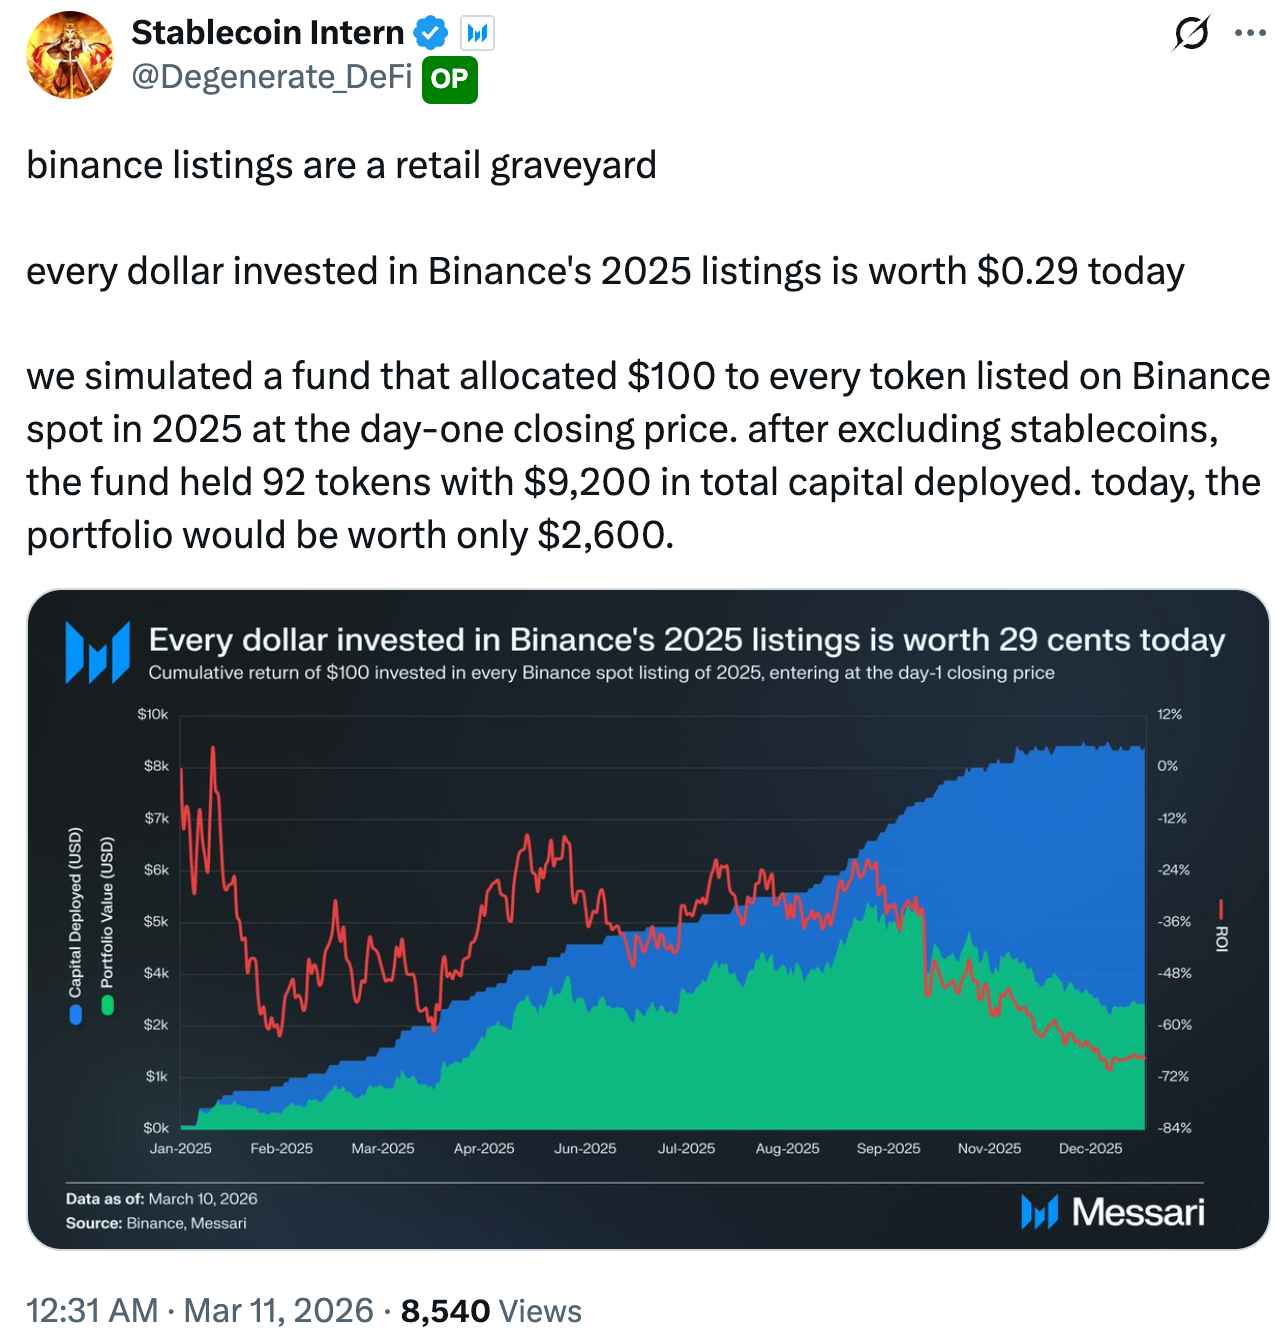
Source: @Degenerate_DeFi
The chart showed that investing $100 in each of the 92 tokens newly listed on Binance in 2025 would leave you with $0.29 per dollar today. That amounts to a cumulative loss of -71.7% on a total investment of $9,200, with only about $2,600 remaining.
Binance is the world's largest exchange. Many expect its listing standards to be stricter than those of smaller venues, and its liquidity is unmatched. If this is the kind of track record that Binance produces, what does the picture look like for Korean exchanges? The Korean market is heavily dominated by retail investors, and its trading patterns differ considerably from global markets. Do these differences show up in the performance of newly listed tokens, or does the data ultimately tell the same story?
In this article, we applied the same methodology used in the Binance analysis to every token that received a new KRW trading pair on Upbit and Bithumb throughout 2025.
The analysis covers all tokens that received new KRW market pairs on Upbit and Bithumb between January 1 and December 31, 2025. This includes 59 tokens for Upbit and 144 for Bithumb. Elixir (ELX), Strike (STRIKE), and AI16Z, which were listed in 2025 but delisted now, were treated as total losses.
The investment simulation rules follow the same framework as the Messari analysis of Binance-listed token performance. We assume a $100 investment at each token's day-1 closing price, with no subsequent selling. The cumulative value and return of this portfolio are tracked daily to construct a time-series dataset.
The choice of day-1 closing price as the entry point is deliberate. On Korean exchanges, opening prices on listing day tend to be inflated by extreme volatility and speculative buying pressure. Using the closing price filters out this noise.
Price data was collected directly through each exchange's public REST API. For Upbit, the daily candle API was used to gather full daily OHLCV data from each token's listing date through March 11, 2026, with current prices verified via the ticker API (/v1/ticker). For Bithumb, the 24-hour candle API was used to obtain data over the same period. For simplicity, fluctuations in the USD-KRW exchange rate were not factored in.
The charts below illustrate the simulation results. The following sections provide detailed explanations and analysis of the data.
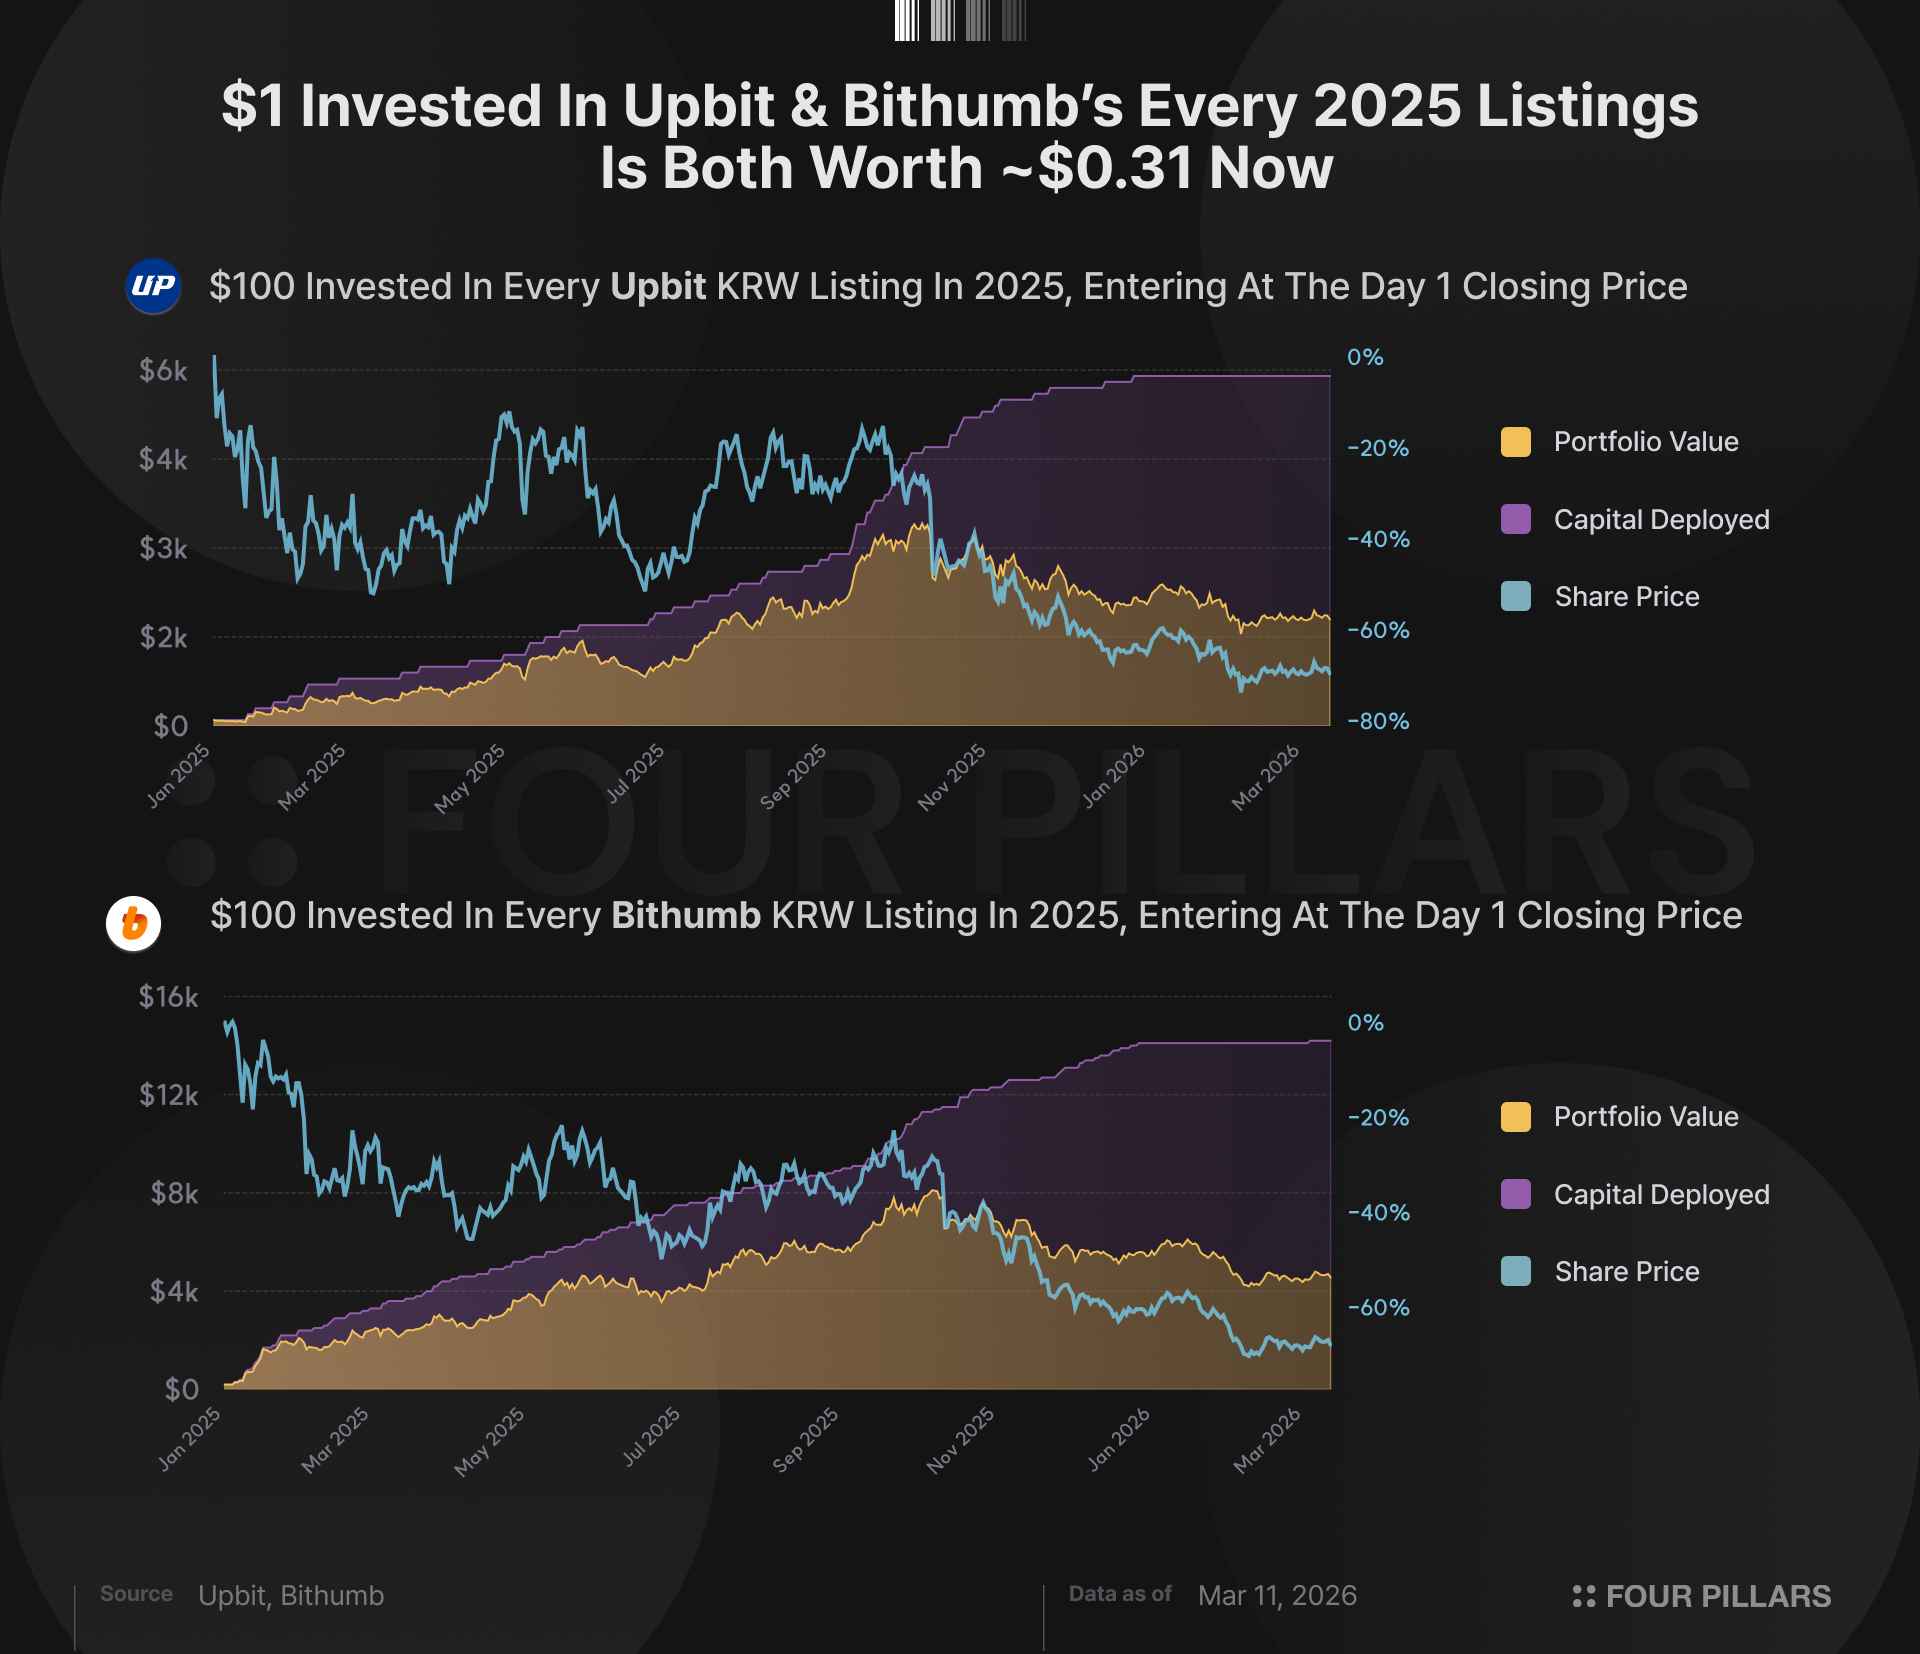
The performance of newly listed tokens in 2025 across the three exchanges is summarized as follows.
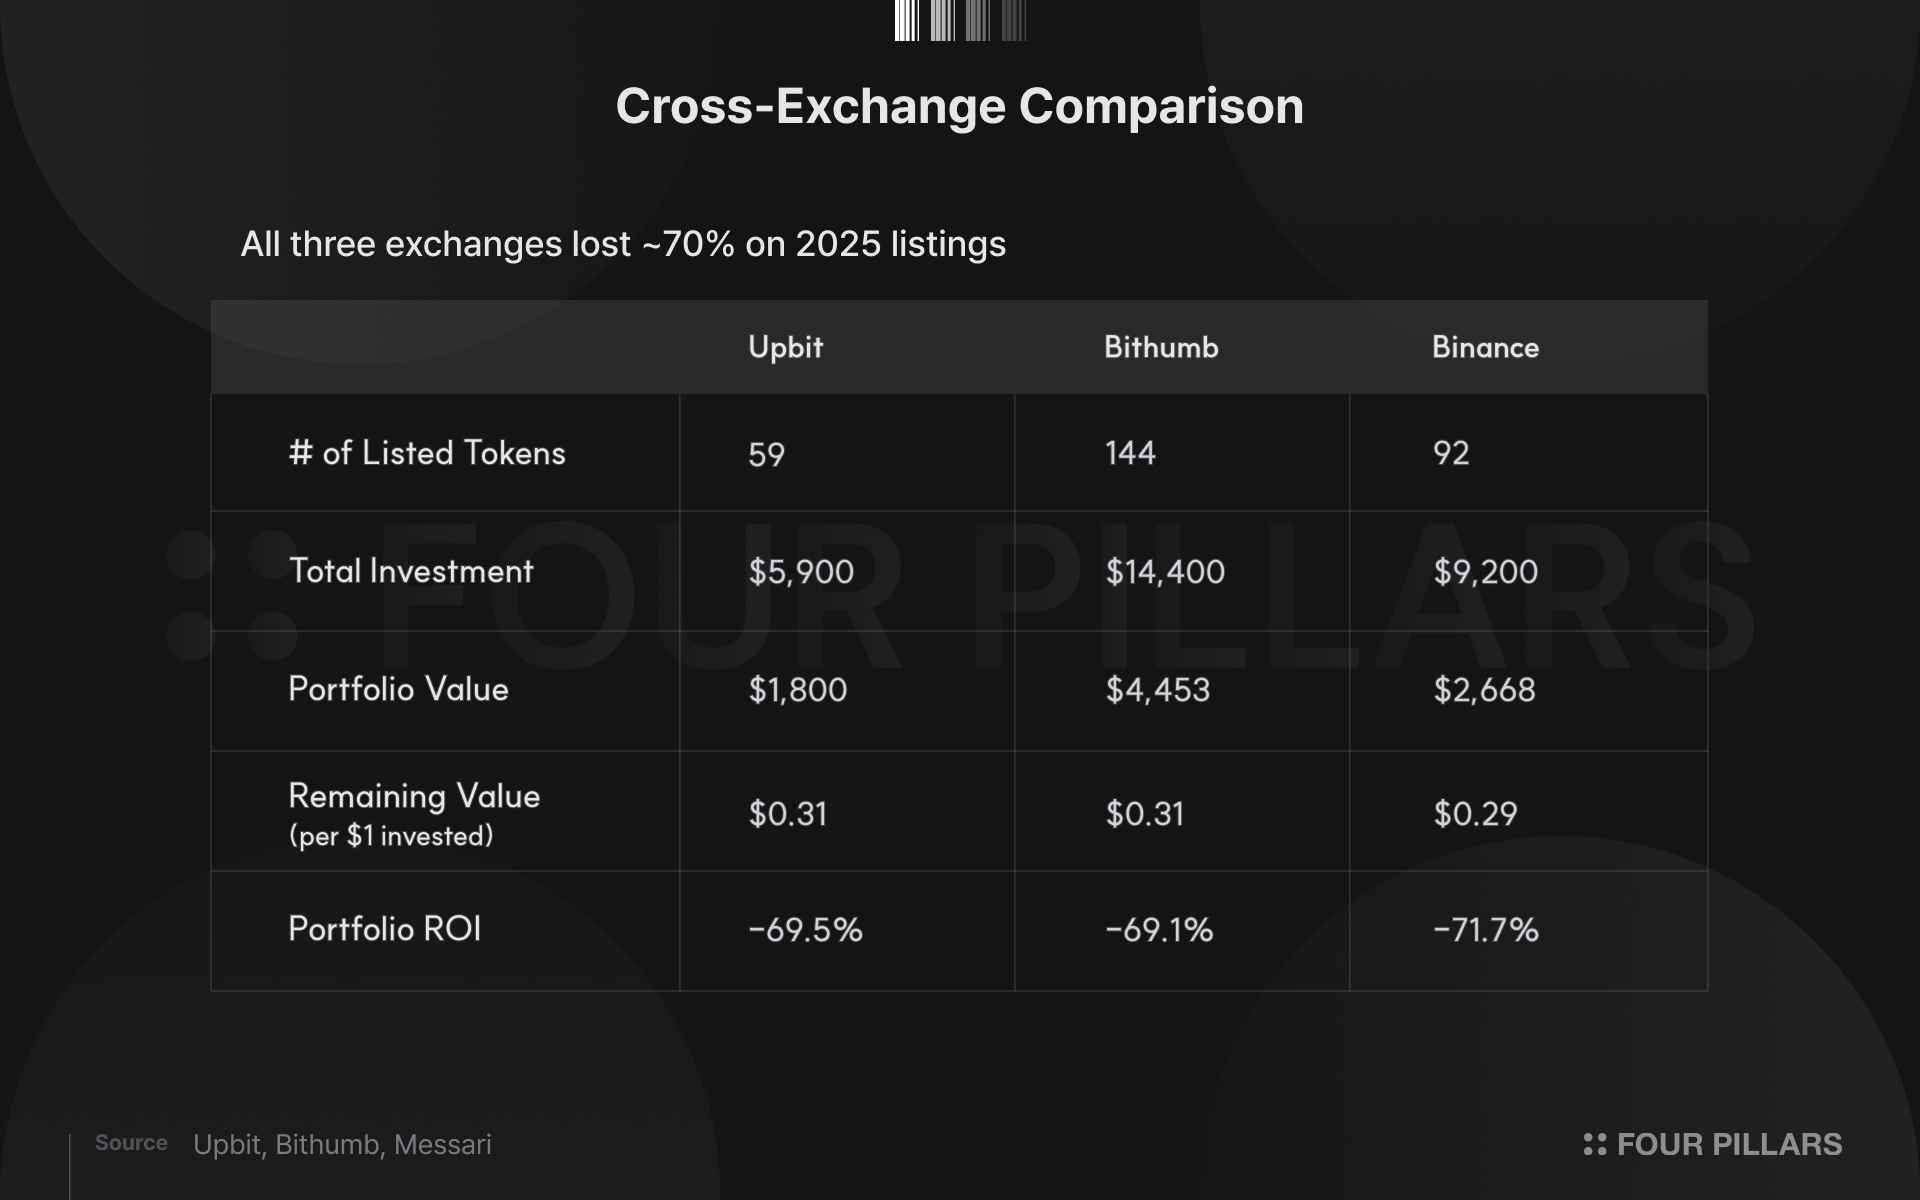
All three exchanges recorded losses in the 70% range. Upbit (-69.5%) and Bithumb (-69.1%) were essentially identical, and Binance (-71.7%) was not far off. Regardless of which exchange you bought newly listed tokens on day one, you lost roughly 70% of your investment on average.
The overall average alone does not capture the distribution of individual token performance. Let us examine the ROI breakdown by range.
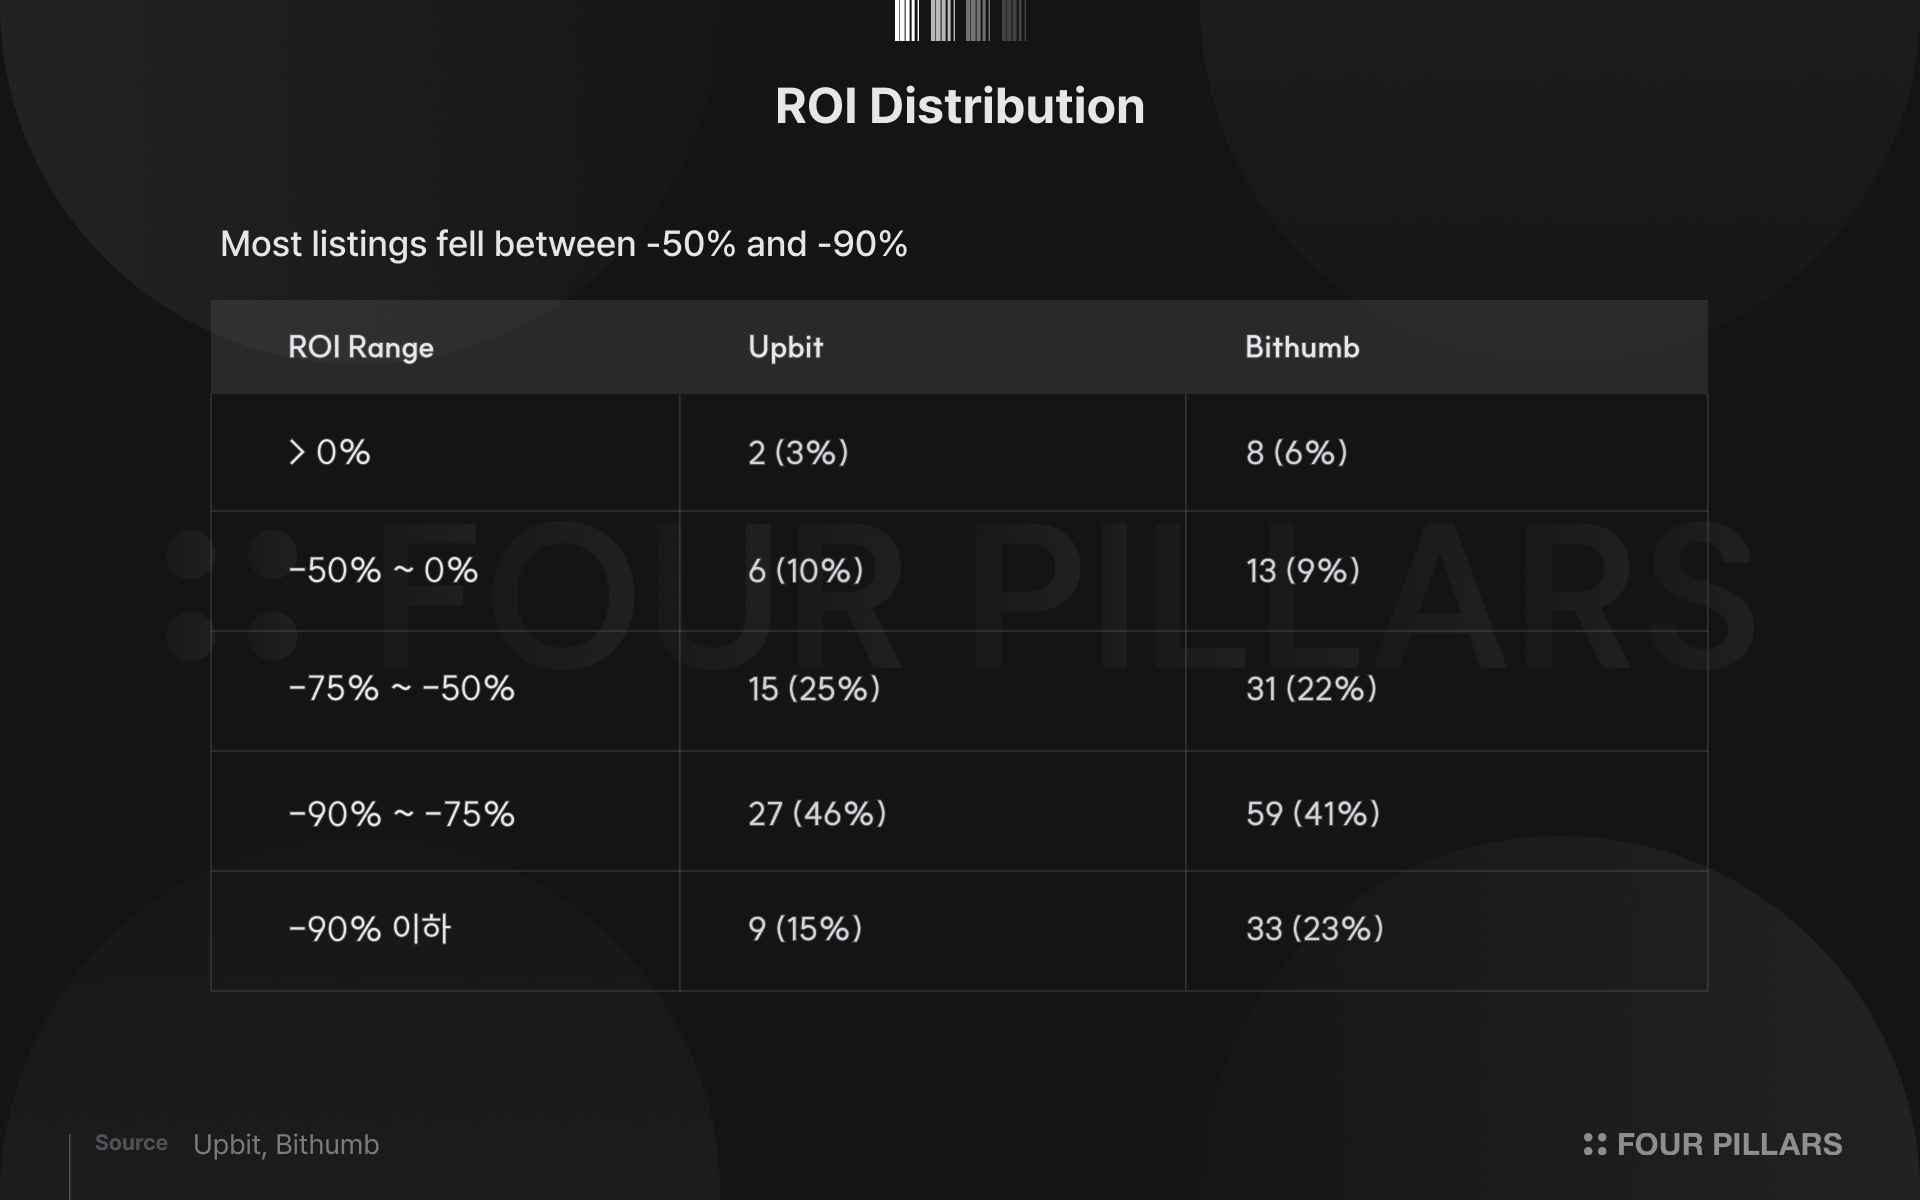
On both exchanges, over 40% of tokens are concentrated in the -75% to -90% range. On Upbit, 46% of tokens fall into this bracket, and 9 tokens (15%) suffered extreme losses beyond -90%. Only two tokens ended in profit: Kite (KITE, +232.8%) and Lombard (BARD, +9.3%).
Bithumb shows a wider distribution. It had more profitable tokens at 8, but also 33 tokens with extreme losses beyond -90%. This wider spread partly reflects the larger sample size of 144 tokens, but it also suggests that Bithumb's listing strategy encompasses a broader spectrum of projects compared to Upbit.
The median ROI tells a starker story: -80.9% for Upbit and -82.1% for Bithumb, both below their respective averages. This means a handful of relatively resilient tokens are pulling the average upward, and the typical outcome for a newly listed token is worse than the headline numbers suggest.
To check whether listing timing affected performance, we split the data into the first half (January through June) and the second half (July through December) of the year.
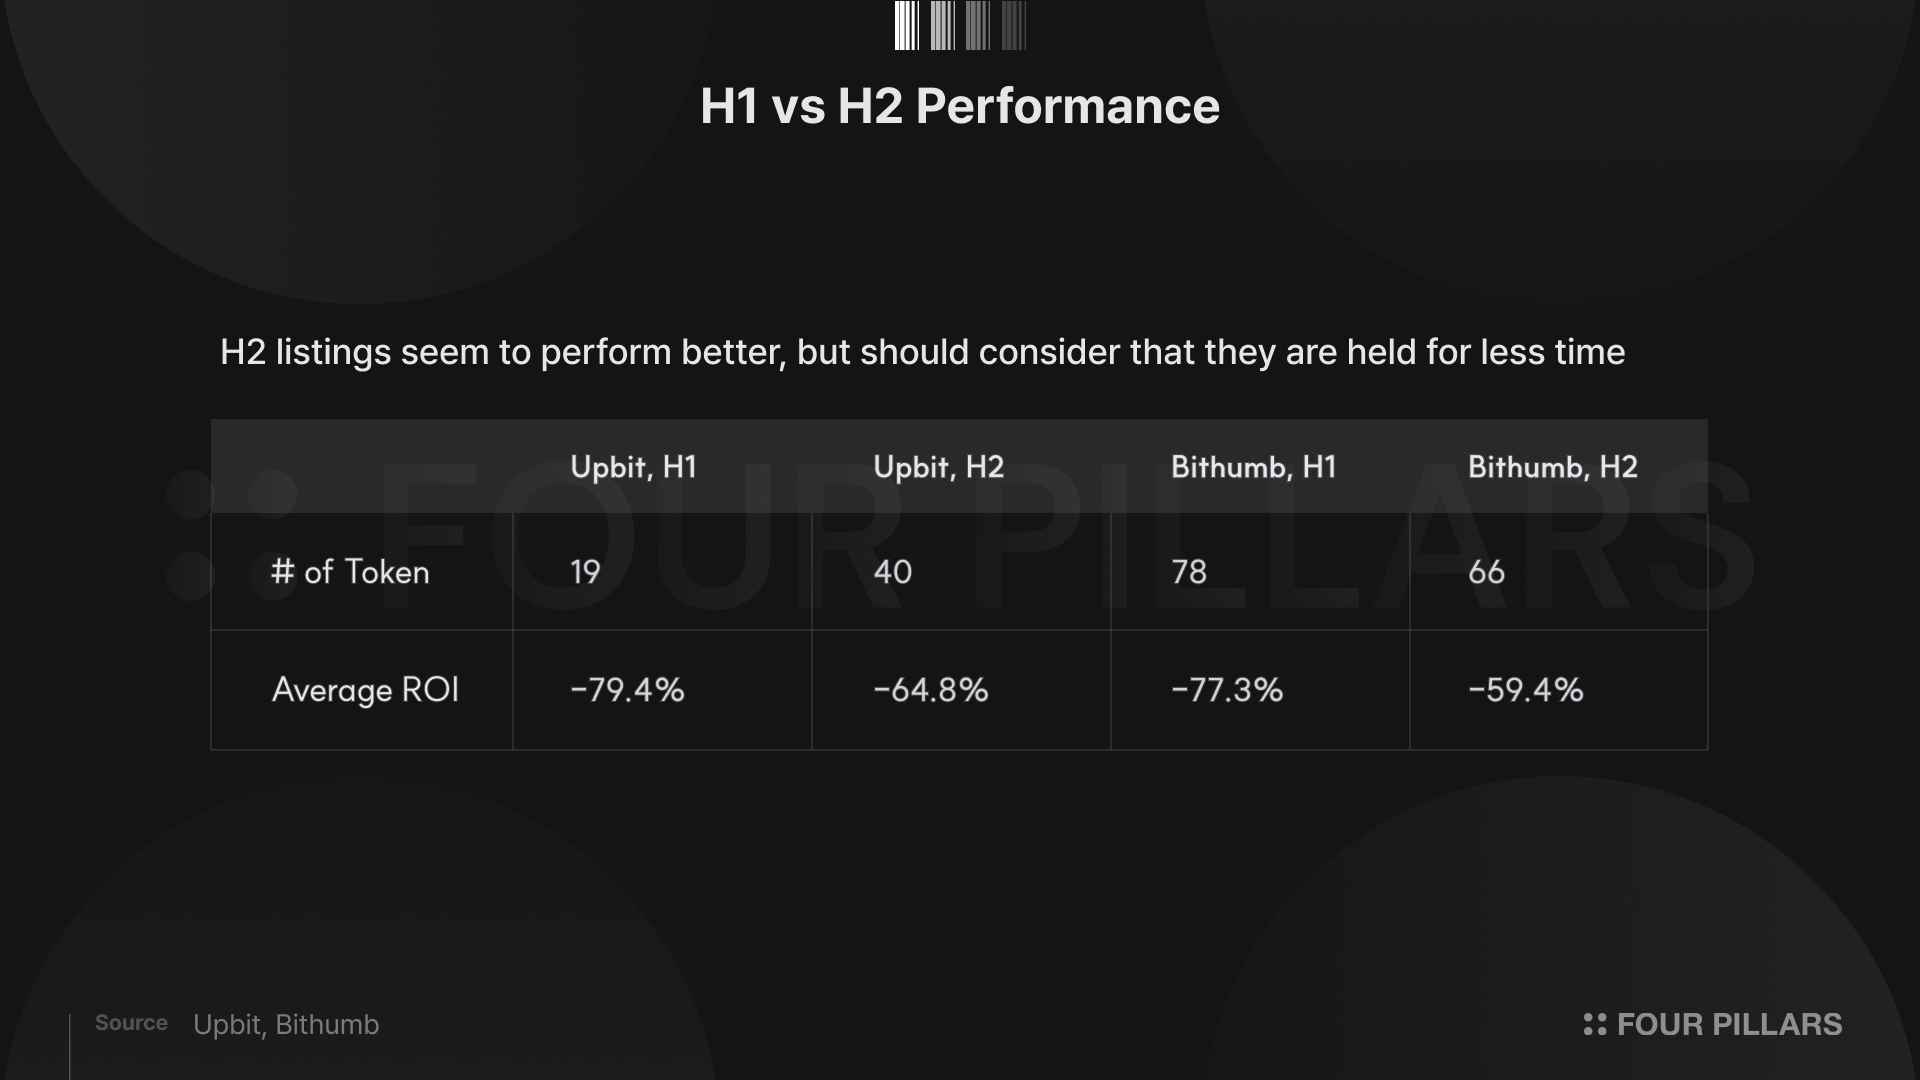
Tokens listed in the second half performed better on both exchanges. This is intuitive: tokens listed earlier in the year simply had more time to decline. Given that the broader crypto market trended bearish throughout 2025, tokens held for longer periods were more likely to accumulate larger losses.
That said, the magnitude of the gap is worth noting. On Bithumb, the difference between first-half (-77.3%) and second-half (-59.4%) listings is roughly 18 percentage points, which is difficult to explain by time effects alone. It is possible that tokens listed in the second half had genuinely stronger fundamentals, or that market expectations had already been tempered by the experience of the first half.
Over the course of 2025, Upbit listed 59 new KRW pairs while Bithumb listed 144. Bithumb's count is more than double Upbit's and significantly exceeds Binance's 92. Upbit's lower count reflects its reputation for having stricter listing standards among Korean exchanges. Despite this, the portfolio ROI for Upbit (-69.5%) and Bithumb (-69.1%) was virtually identical.
To dig deeper, we compared the performance of tokens listed on both major exchanges against those listed only on Bithumb. A total of 50 tokens were listed on both Upbit and Bithumb.
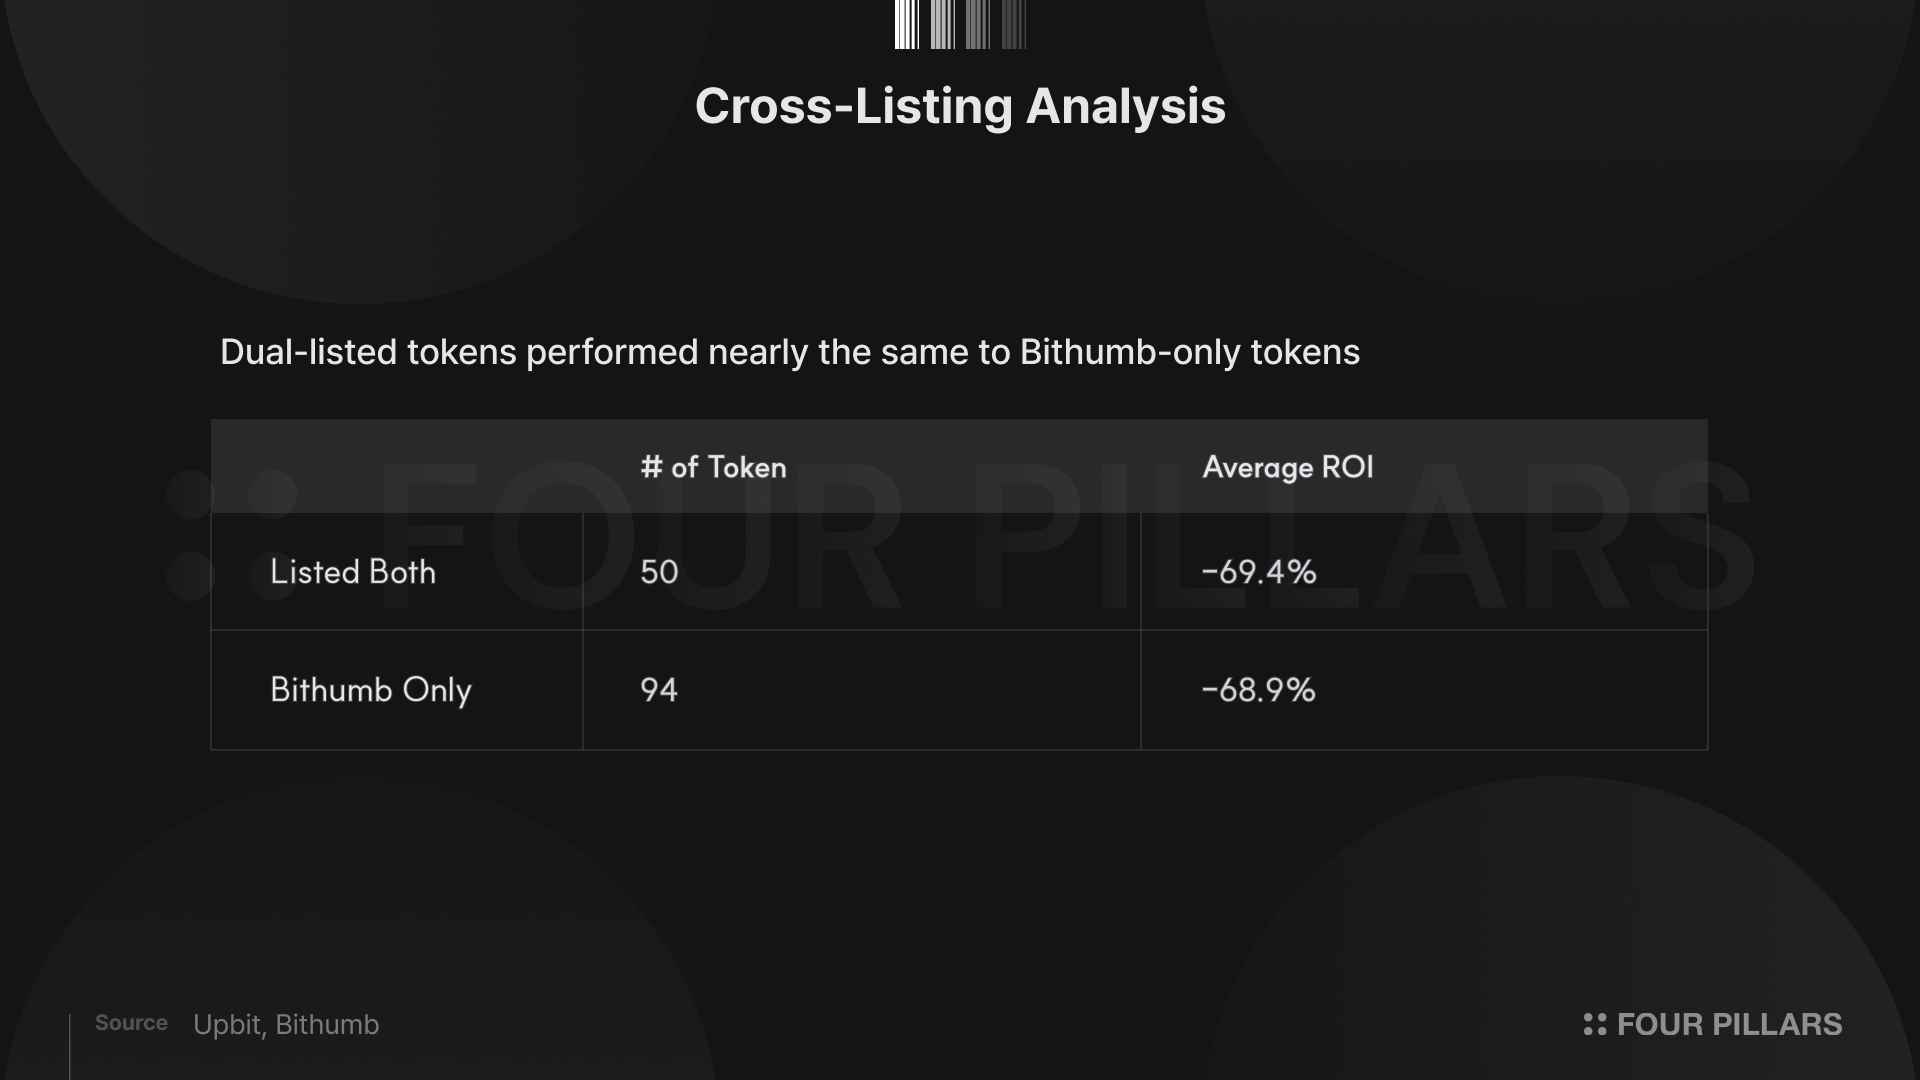
Tokens listed on both exchanges would presumably represent projects with a certain level of industry recognition. However, the average ROI of these 50 tokens (-69.4%) was essentially the same as that of the 94 tokens listed only on Bithumb (-68.9%).
This finding points to two conclusions.
First, being listed on multiple major exchanges does not guarantee subsequent price performance.
Second, the day-one price inflation driven by listing events occurs as a structural phenomenon, regardless of how much attention a project receives.
Whether a token had the prestige of being listed on Upbit as well, or was quietly listed only on Bithumb, the losses experienced by day-one buyers were ultimately the same.
Of Upbit's 59 listed tokens, only KITE (+232.8%) and BARD (+9.3%) finished in profit. Only 8 tokens managed to stay above -50%.
Bithumb's 8 profitable tokens make for a more interesting mix.
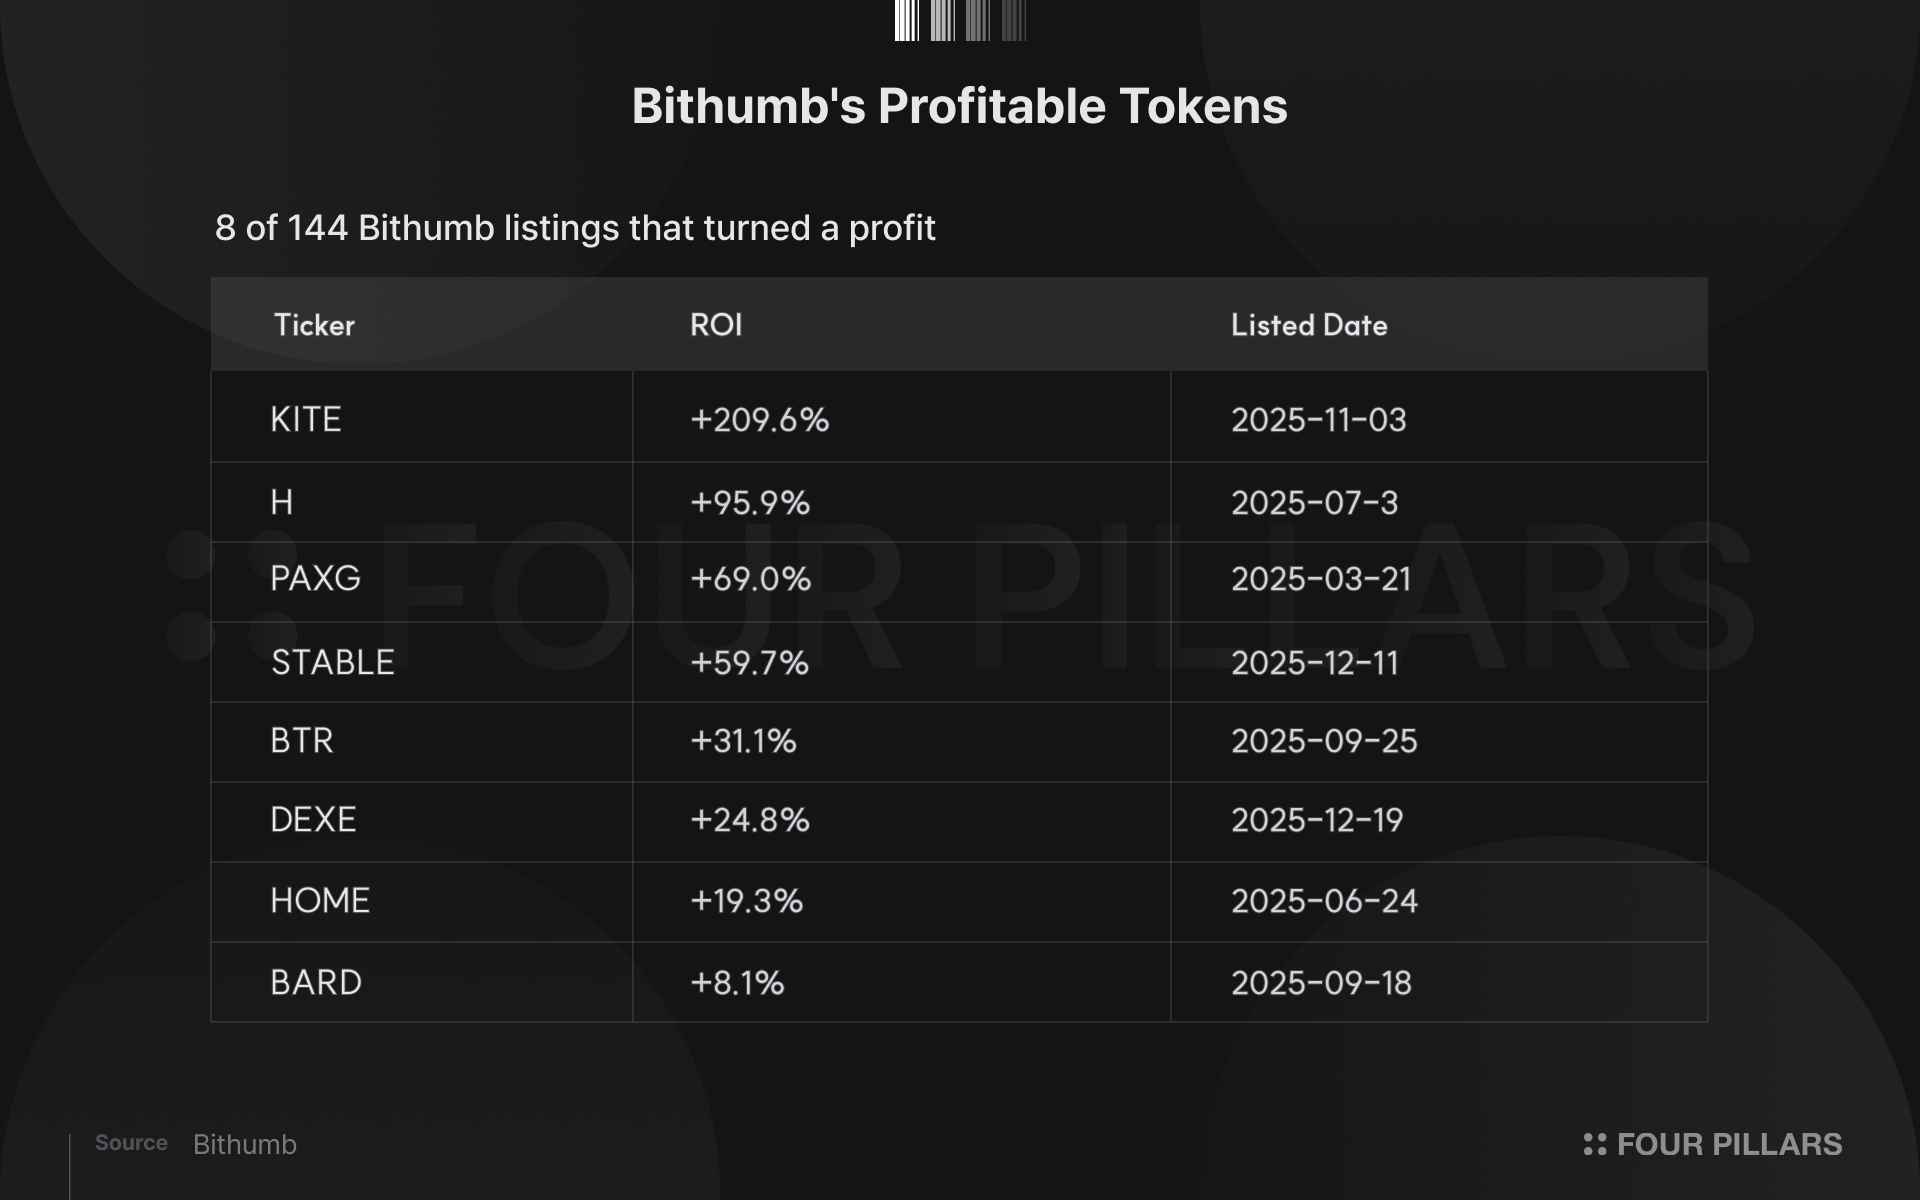
KITE's +209.6% return is a notable outlier, but the token has only been listed for four months, making it premature to interpret this as a durable long-term result. STABLE and DEXE are similarly limited by their three-month track records.
The more noteworthy case is PAXG. As a token pegged 1:1 to the spot price of gold, its +69.0% return was driven entirely by the steady rise in gold prices throughout 2025. This performance has nothing to do with crypto market fundamentals and simply reflects the macro trend in gold. Put differently, the most reliable way to make money on Bithumb was to not invest in a crypto token.
This analysis concludes that the performance of newly listed tokens on Korean exchanges in 2025 was structurally no different from that of Binance. Despite the Korean market's distinctively high retail participation, differing listing strategies between exchanges, and a different regulatory environment, the average losses experienced by day-one buyers converged at approximately 70% across all three exchanges.
The key takeaway from this data, in our view, is that the root cause lies not in any particular exchange's listing standards or in the quality of individual tokens, but in the structural dynamics inherent to the listing event itself. When a token is newly listed on a major exchange, concentrated retail demand inflates the price on day one. As time passes, prices naturally correct, translating into losses for day-one buyers. The fact that tokens listed on both major exchanges performed identically to those listed on only one suggests that these losses are not a function of a specific exchange or token, but a structural feature of the listing event.
One caveat is warranted. This analysis measures the performance of one specific strategy: buying at the day-one closing price and holding through today. Short-term trading strategies that exploit price patterns in the days following a listing, or strategies that enter after a substantial decline, could paint an entirely different picture. Such strategies, however, require precise timing judgment and are far removed from what most retail investors actually do.
The lesson from 2025's data is straightforward. Buying a token simply because it was newly listed on a major exchange was a systematically losing strategy, regardless of which exchange you used. This pattern is not unique to Korea; it is a global structural problem. The cause is not that exchanges are selecting bad tokens, but that the listing event itself creates a demand concentration dynamic that consistently works against day-one buyers.
Dive into 'Narratives' that will be important in the next year