Tokens aren’t equity. Use EV/Holder Revenue, not EV/Protocol Revenue.
The accrual ratio (that % of protocol revenue actually reaches holders) is a revealing diagnostic. It ranges from 100% to 25% across our comp.
Not all “dilution” is the same. Team comp is an expense (in the multiple). Investor selling is a market event (out of the multiple).
Treasury Claim Discount: the question isn’t “what’s in the treasury” but “can holders get it out?”
This is a prototype framework. The excel file is attached, so feel free to improve it.
There's a common shortcut in crypto valuation that I kept running into. Someone pulls up a protocol doing $500M in annualized fees, divides market cap by that number, gets a single-digit multiple, and calls it cheap. The denominator is wrong and the numerator is wrong, and the investor ends up buying a 5x multiple that’s actually a 20x once you account for how little of that revenue they’ll ever see.
P/E ratios are a fine starting point, but they miss balance sheets and capital structure, which is exactly why EV/EBITDA exists in tradfi. The problem is that when you try to adapt EV/EBITDA for tokens, three things break: treasuries with zero legal claim, protocol revenue that never reaches holders, and the largest cost line showing up as new token supply instead of on an income statement.
This piece builds the adaptation. The core metric is EV/Holder Revenue — what you’re paying per dollar that actually reaches you as a tokenholder, adjusted for balance sheet and real business costs. I walk through five protocols (HYPE, PUMP, MAPLE, JUP, SKY) not as investment theses but as illustrations. The Excel model is attached. Stress-test the assumptions, swap in your own numbers. One caveat, then I’m done with caveats: this is a prototype, not a finished product. If you find a better way to handle treasury claims or token costs, please publish it.
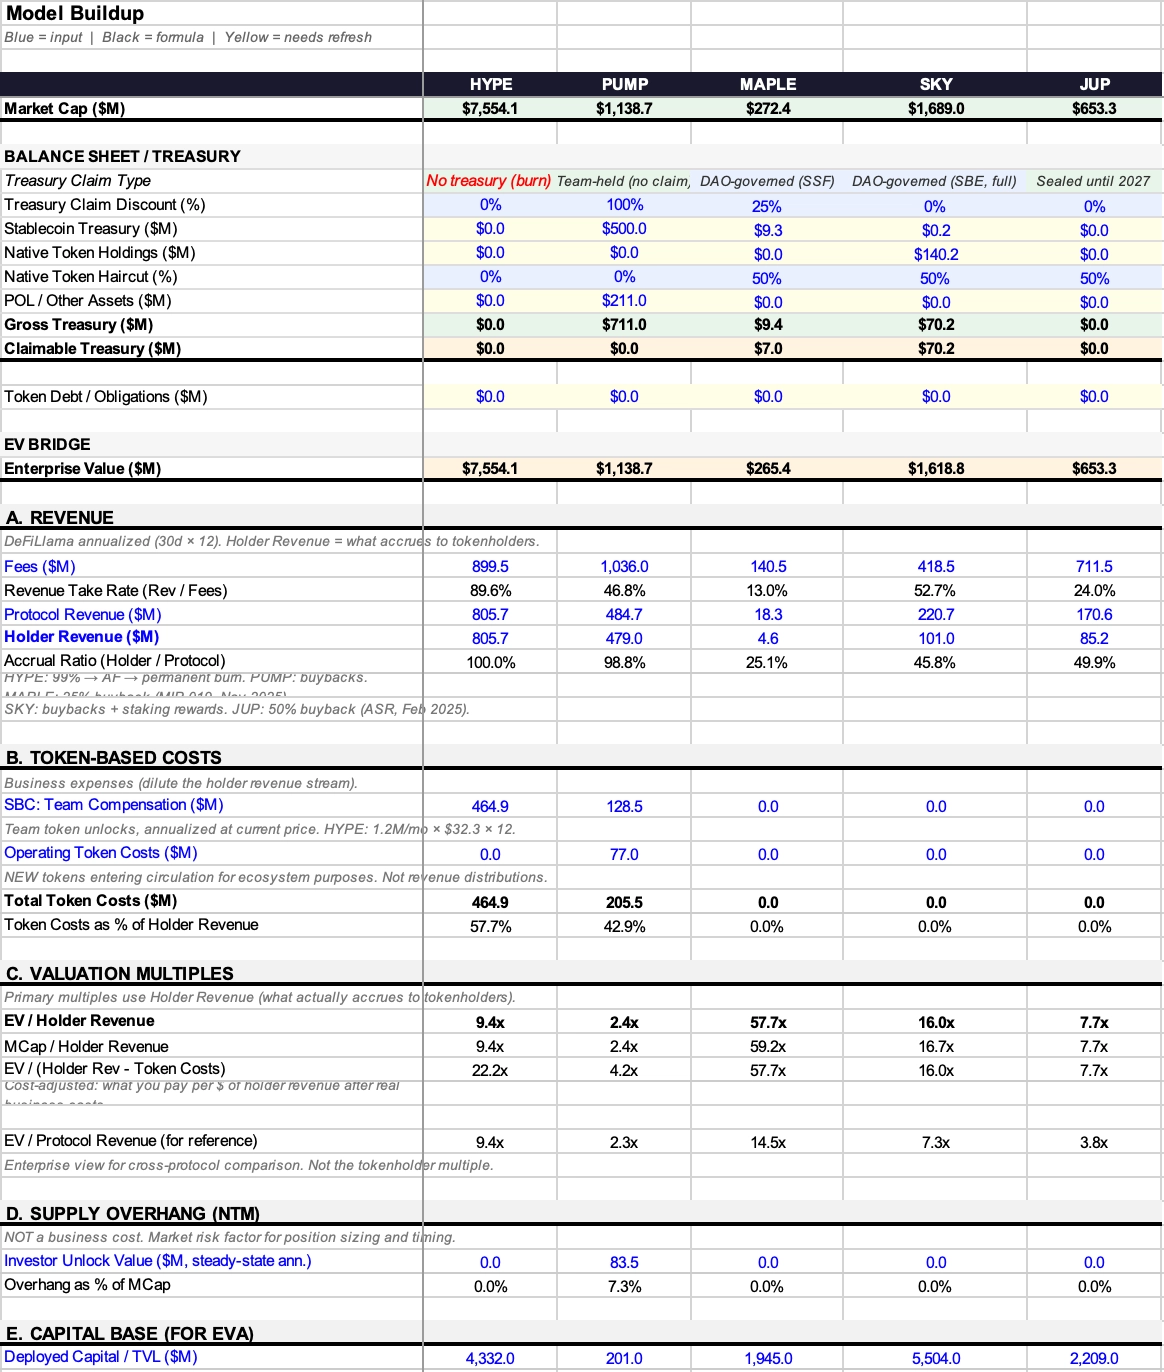
The first thing most token valuations get wrong is the starting number. Market cap is not enterprise value. In TradFi the logic is clean: enterprise value equals market cap plus debt minus cash. Buy 100% of the shares, you assume the debt and you pocket the cash. The subtraction makes sense because the cash is yours — by legal right, enforceable in court. In crypto, that claim ranges from automated burns (where USDC goes in and tokens get permanently destroyed — no one owns the residual) to foundation wallets sitting on hundreds of millions with zero governance and no distribution mechanism. The question isn’t what’s in the treasury, but whether tokenholders can get it out (Of course, if someone acquires the entire protocol the discount disappears and the treasury is theirs, same as TradFi. The Claim Discount only matters for minority holders, which is what most of us are.)
I’m keeping the term “enterprise value” even though there’s no enterprise in the TradFi sense, because the logic is identical: you’re trying to figure out what you’d pay for the operating business after netting out balance sheet claims. The formula is EV = Market Cap + Token Debt - Claimable Treasury. Most protocols don’t have token debt yet, so in practice the interesting part is entirely on the treasury side.
Start with the decomposition. A protocol treasury typically holds three things: stablecoins (real money, fully claimable in principle), native tokens (circular — you’re subtracting the protocol’s own token from its market cap, which is a 50% haircut at best), and protocol-owned liquidity or other less liquid assets. Gross treasury = stables + native tokens multiplied by one minus whatever haircut you think is appropriate, plus POL. But gross doesn’t mean claimable, and that’s where the framework earns its keep.
Not every protocol even has a treasury to discount. A pure burn mechanism (USDC flows in, tokens get purchased and sent to a permanently inaccessible address) doesn’t create a balance sheet asset anyone can access. Claimable treasury equals zero, EV equals market cap. That’s actually the cleanest case because there’s no judgment call involved, no argument about what discount to apply.
For protocols that do hold real treasuries, I use a Claim Discount framework, a spectrum from zero to one hundred percent based on how much access tokenholders actually have. At 0%, you’ve got automated buyback-and-burn requiring no governance vote or funds where tokenholders have all the right to free decide on how it’s going to be used. At 25%, an active DAO with actual distribution history. At 50%, governance rights that exist on paper but have never been exercised. At 75%, team-held treasuries with weak governance. And at 100%, foundation-controlled funds where tokenholders have no claim at all. The percentages are the most attackable part of this entire framework, and I know it. Two analysts disagreeing on 25% versus 50% is a vastly better conversation than two analysts quoting P/E ratios and ignoring the treasury entirely.
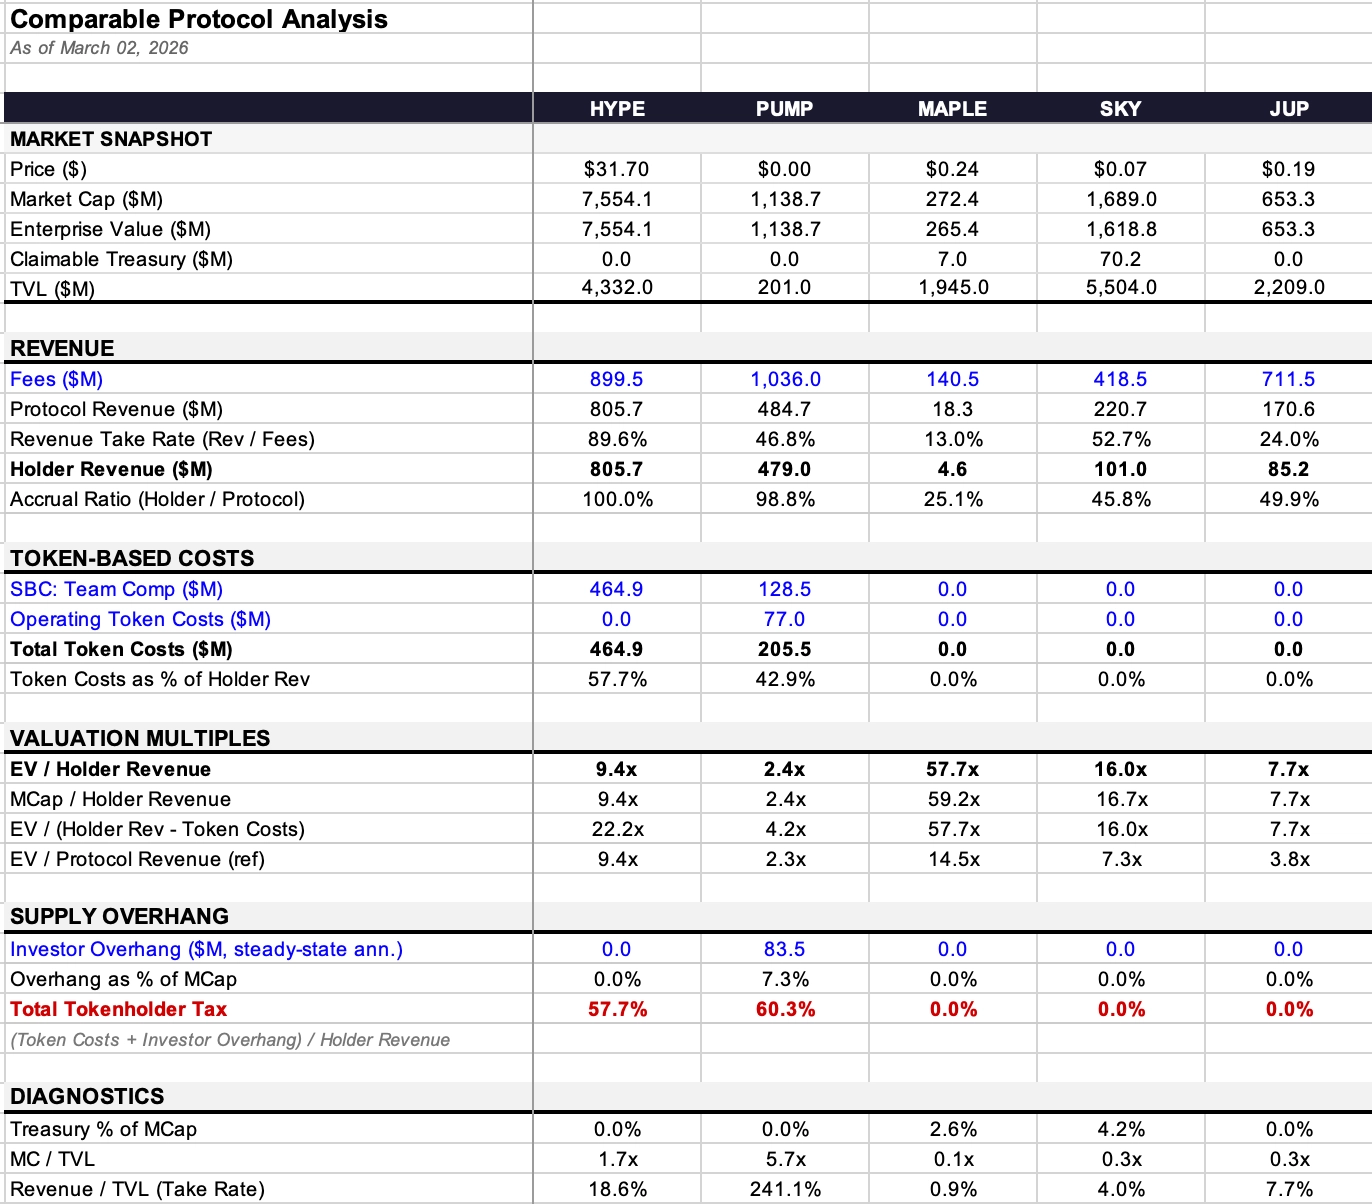
Here’s how it plays out in our comp. Maple sits on $9.36M in treasury (99.7% stables) — small enough that the EV adjustment barely moves the number, taking EV from $272M market cap to $265M. SKY holds $140.3M, but 99.9% of that is the protocol’s own token; after a native haircut, the claimable value I assign is $70.2M, bringing EV from $1.69B to $1.62B. PUMP reportedly holds ~$700M in stables, but with zero governance and no distribution mechanism, the claimable amount is $0 — you can’t get it out, so EV equals market cap. Same logic applies to HYPE and JUP: clean burns or sealed treasuries, no judgment call needed.
The gap between what a protocol earns and what holders receive is where most frameworks fail, and the number that changes the valuation multiple once you account for it.
Think of the revenue path as a waterfall with three tiers. Fees are what users pay (the gross number). Protocol revenue is what the protocol keeps after paying LPs, validators, or whatever supply-side participants make the service work. Holder revenue is what reaches tokenholders through buybacks, burns, or direct distributions. Two conversion rates govern the flow: the revenue take rate (protocol revenue divided by fees), which tells you how much the protocol captures from gross activity, and the accrual ratio (holder revenue divided by protocol revenue), which tells you how much of that capture reaches the people holding the token.
The compound effect of these two filters can be massive. HYPE runs an 89.6% take rate and a 100% accrual ratio — nearly every dollar of the $899.5M in fees flows through to $805.7M in holder revenue. Maple generates $140.5M in fees but keeps only $18.3M as protocol revenue (13% take rate), and of that, just $4.6M reaches holders (25.1% accrual). A 3% cumulative pass-through from fees to holders versus 90%, on the same framework. If you’re comparing these two protocols on EV/Fees or even EV/Protocol Revenue, you’re comparing apples to oranges.
Why holder revenue instead of protocol revenue as the denominator? In TradFi, EV/Revenue works because equity holders own the residual — the entire waterfall is theirs by legal right. Tokenholders don’t have that. They have whatever claims the token design gives them, and nothing more. Revenue sitting in a team-controlled treasury with no holder mechanism isn’t “yours” just because you hold the governance token. Using protocol revenue in the denominator flatters protocols with low accrual ratios — it makes them look cheaper than they actually are to the people buying the token. I call the gap between EV/Protocol Revenue and EV/Holder Revenue the accrual discount. For Maple, that gap is 4x: a 14.5x protocol rev multiple versus 57.7x on holder rev. Same data, radically different picture of what the market is charging you.
Now for costs. The word “dilution” is doing too much work in crypto, and getting the categorization wrong means getting the valuation wrong.
Stock-based compensation (team tokens) is an expense. Buffett made the argument decades ago: if comp isn’t a cost, what is it? A gift? In TradFi this hits the income statement and reduces earnings. In crypto it shows up as new token supply hitting the market, but economically it’s identical. HYPE’s team comp runs at $464.9M annualized, consuming 57.7% of holder revenue. PUMP’s is $128.5M. These are real costs of running the business and they belong in the valuation multiple.
Operating token costs (ecosystem emissions, incentive programs, tokens minted to acquire users) function as customer acquisition costs. Also real expenses, also in the multiple. PUMP runs $77M in operating token costs on top of its team comp, bringing total token costs to $205.5M. The key test: is new supply being created? If the protocol routes existing revenue to stakers, no new tokens are minted and the cost is already captured in the waterfall — it shows up as the gap between protocol revenue and holder revenue. If the protocol mints or unlocks tokens that didn’t previously exist in float, that’s real dilution and it’s a business cost.
Investor lockup expiry is different. It’s a market event, not a business cost. You wouldn’t subtract VC selling from Apple’s revenue to get an “adjusted multiple.” PUMP has $83.5M in annualized investor overhang, which is 7.3% of market cap, and that matters enormously for price action and market dynamics. But it doesn’t belong in the operating multiple. I capture it separately in a diagnostic called Total Tokenholder Tax (token costs plus investor overhang as a percentage of holder revenue) but it stays out of the core valuation metric.
This gives us four multiples, defined once here and referenced by label only from now on. EV/Holder Revenue is the primary metric: what you pay per dollar that reaches you. MCap/Holder Revenue is the same without the treasury adjustment; when these two diverge, the gap is the balance sheet. EV/(Holder Revenue minus Token Costs) is the cost-adjusted multiple that captures real business expenses but excludes investor overhang. And EV/Protocol Revenue is reference only; its gap from EV/Holder Revenue measures the accrual discount.
Lastly, the Total Tokenholder Tax isn’t in the multiple. It’s a diagnostic that captures the combined headwind from business costs and supply pressure in one number. PUMP’s total tax runs at 60.3%, HYPE’s at 57.7%, while Maple, JUP, and SKY sit at 0% because they currently have no active emissions or vesting. That 60% figure doesn’t mean the token is overvalued; it means that for every dollar of revenue reaching holders, another sixty cents is being offset by new supply entering the market. Whether you care about that depends on your time horizon and your view on whether the emissions are building something that generates more revenue later.
The table below puts all five protocols on the same page — market snapshot, revenue waterfall, token costs, valuation multiples, and supply overhang in one view. Model with all inputs and assumptions available as a downloadable spreadsheet.
HYPE is at 9.4x on holder revenue — every dollar of protocol revenue reaches holders through the burn, the highest accrual ratio in the comp. Team comp consumes 57.7% of that holder revenue, pushing the cost-adjusted multiple to 22.2x. The protocol rev and holder rev multiples converge perfectly here, which tells you the revenue waterfall isn’t where the complexity lives.
PUMP is the cheapest headline multiple in the comp at 2.4x with near-perfect accrual (98.8%). But the treasury, despite reportedly holding hundreds of millions in stables, is worth $0 to holders because there’s no governance mechanism to access it, and August 2026 brings a vesting cliff — team and investor unlocks starting with no clean quarter between ecosystem emissions ending and new supply hitting. The cost-adjusted multiple jumps to 4.2x, the tokenholder tax is the highest in the comp at 60.3%.
MAPLE has the widest accrual discount in the comp — that 4x spread between protocol rev and holder rev multiples, visible in a single glance. The protocol manages $3.79B in AUM with a 128 basis point NIM, paying depositors 4.5% on a 5.5% borrower rate. Zero token costs mean the cost-adjusted multiple converges with the headline, and credit risk is managed through a 175.7% collateral ratio on $822M in loans.
JUP is the cleanest balance sheet in the comp. Net-Zero Emissions governance, passed with 75% approval in February 2026, is the strongest supply discipline of any protocol here. Hence zero token costs, zero investor overhang, zero claimable treasury — all four multiples converge at or near 7.7x. Treasury is modeled at $0 not because it doesn't exist, but because the DAO treasury is sealed until 2027 and the Litterbox Trust (which held 34.4M JUP as of December 31, 2025 after burning ~130M JUP in November) continues accumulating from 50% of on-chain revenue.
SKY runs a wider NIM than Maple with structural pricing power from CDPs — the 4.0% SSR against higher borrower rates generates $220.7M in protocol revenue off $5.5B in TVL, and SFF projects are producing $611.5M in gross revenue with 81% year-over-year growth. But the treasury is almost entirely the protocol’s own token: $140.3M in assets, 99.9% SKY, claimable value of $70.2M after the native haircut. The protocol rev multiple (7.3x) and holder rev multiple (16.0x) diverge on a 45.8% accrual ratio — the clearest illustration in this comp of why the denominator you choose determines whether a protocol looks cheap or expensive.
This framework has holes. For example, the Treasury Claim Discount is subjective — my 25% is your 50%, and neither of us can prove it. The “is new supply being created?” test for token costs sounds clean until you find a protocol with an active mint function, a dead distribution channel, and no one checking whether tokens are accumulating in an undistributed pool. And DeFiLlama’s 30-day annualization can make a protocol look 2x cheaper or 2x more expensive depending on which month you snapshot.
But it is a starting point. EV/Holder Revenue, adjusted for balance sheet and real business costs, tells you what you’re paying for each dollar of revenue that actually reaches you as a tokenholder.
The gap between what protocols earn and what tokenholders receive is the single biggest fundamental mismatch in this market. Protocols generating hundreds of millions in fees while holders see a fraction of it, and most valuation frameworks don’t even distinguish between the two. Fee switches are flipping, buyback mechanisms are replacing inflationary staking, governance is voting to pause emissions. The industry is starting to take value accrual seriously, but we’re still early in building the tools to measure what’s actually happening.
I built this framework because I needed it for my own work. I’ve used some version of this approach on the thesis I’ve published. The Excel is attached. Break the model, rebuild it better. If someone takes this and turns it into something more rigorous, that’s the point.
Revenue: DeFiLlama Annualized (30d x 12). More responsive than 6mo x 2 but noisier. Holder Revenue = DeFiLlama “Holders Revenue.” Tracks buybacks, burns, distributions only.
Treasury: MAPLE $9.36M (DeFiLlama, 99.7% stables). SKY $140.3M (DeFiLlama, 99.9% own tokens). JUP $0 (sealed). PUMP $500M stables mid-range estimate (true range $286M-$800M).
Token costs: MAPLE $0 — MIP-019 (Oct 2025) ended staking distribution. 5% inflation smart contract may still mint but no distribution channel. On-chain verification gap. Sources: docs.maple.finance, The Defiant Oct 31 2025.
Token costs: SKY $0 — STR module now distributes SPK + Chronicle Points, not SKY. Verified app.sky.money/rewards Mar 2026. 600M SKY/year figure from Rune’s Aug 2024 post is stale. Governance can reactivate. Sources: sky.money FAQ, vote.sky.money.
Token costs: JUP $0 — Net-Zero Emissions Feb 22 2026 (75% vote). Litterbox balance holds 34.4M $JUP as of Dec 31, 2025 post-Nov 2025 burn. DAO treasury sealed until 2027.
PUMP: Overhang = steady-state annual ($83.5M). Cliff starts Aug 2026; actual NTM = ~$48.7M (7/12 months).
Lending metrics: MAPLE uses actual AUM ($3.79B, Q1 2026 report) not DeFiLlama TVL ($1.945B). NIM = Protocol Rev / AUM. Full lending metrics in Excel Appendix tab.
Cash OpEx: NOT estimated. Deliberate — protocols don’t disclose and guessing creates false precision.
SBC priced at current token price. Sensitivity to price changes is material.
https://docs.google.com/spreadsheets/d/1PzqSTo0F3-yUqvo9AW8eoo0gvuLJVYzRD8N9pCmpxrI/edit?usp=sharing
Dive into 'Narratives' that will be important in the next year