$328M in buybacks at 99.5% daily precision for 8 months, corroborated by two independent aggregators that weren’t consulted and agree on the number. Manipulating numbers requires fabricating revenue that simultaneously fools DeFiLlama, matches Adam_tech’s Dune Solana-only indexing at a stable 68-69% ratio, and is backed by 105.17B PUMP sitting in verifiable wallets.
The August 2026 “dilution cliff” is a substitution, not a stack, and the buyback absorbs 2x new supply at current revenue. Community emissions stop when team/investor vesting starts. Monthly emissions go from 10B to 9.2B.
What’s actually suppressing the multiple is categorical (sin stock), trust-based (pseudonymous team, discretionary buyback), and flow-driven (alleged insider selling into the buyback).
There's a rumor on CT that Pump.fun's revenue is manipulated. Here's why I think the rumors are false.
As of March 15, 2026, fees.pump.fun reports $328,460,856 in cumulative buybacks. That’s 2,283,518 SOL spent acquiring 104.5B PUMP, roughly 10.45% of total supply and 29.52% of circulating supply offset. The daily allocation runs between 99.5-100.5% of protocol revenue, every day for eight months, averaging $1.25M/day through February 2026. Manipulation requires huge capital: every dollar of buyback is a dollar of SOL leaving verifiable wallets to purchase tokens sitting in auditable addresses. Faking $328M in revenue costs $328M.
The tokens sit on-chain for anyone to verify (wallet G8CcfRff holds 103.96B PUMP, 8PSmqJy6 holds 1.21B, totaling 105.17B as of March 17). The initial execution wallet 3vkpy5Y, Solscan-labeled “Pump Buy Back,” is now empty after routing tokens to the holding wallets and rotating in August 2025.
DeFiLlama’s protocol revenue from July 15, 2025 through February 21, 2026 totals $300,041,880. fees.pump.fun’s cumulative buyback over the same window: $300,178,162. That’s a 100.05% match, a $136K cumulative discrepancy on $300M between two systems that don’t talk to each other.
Adam_tech’s Dune dashboard add a third layer, tracking Solana-only revenue at a stable 68-69% of DeFiLlama’s multi-chain figure because Dune doesn’t index the Padre revenue on Base, Ethereum, and BNB Chain that launched October 2025. The ratio holds day-to-day, which means both are reading the same on-chain events independently.
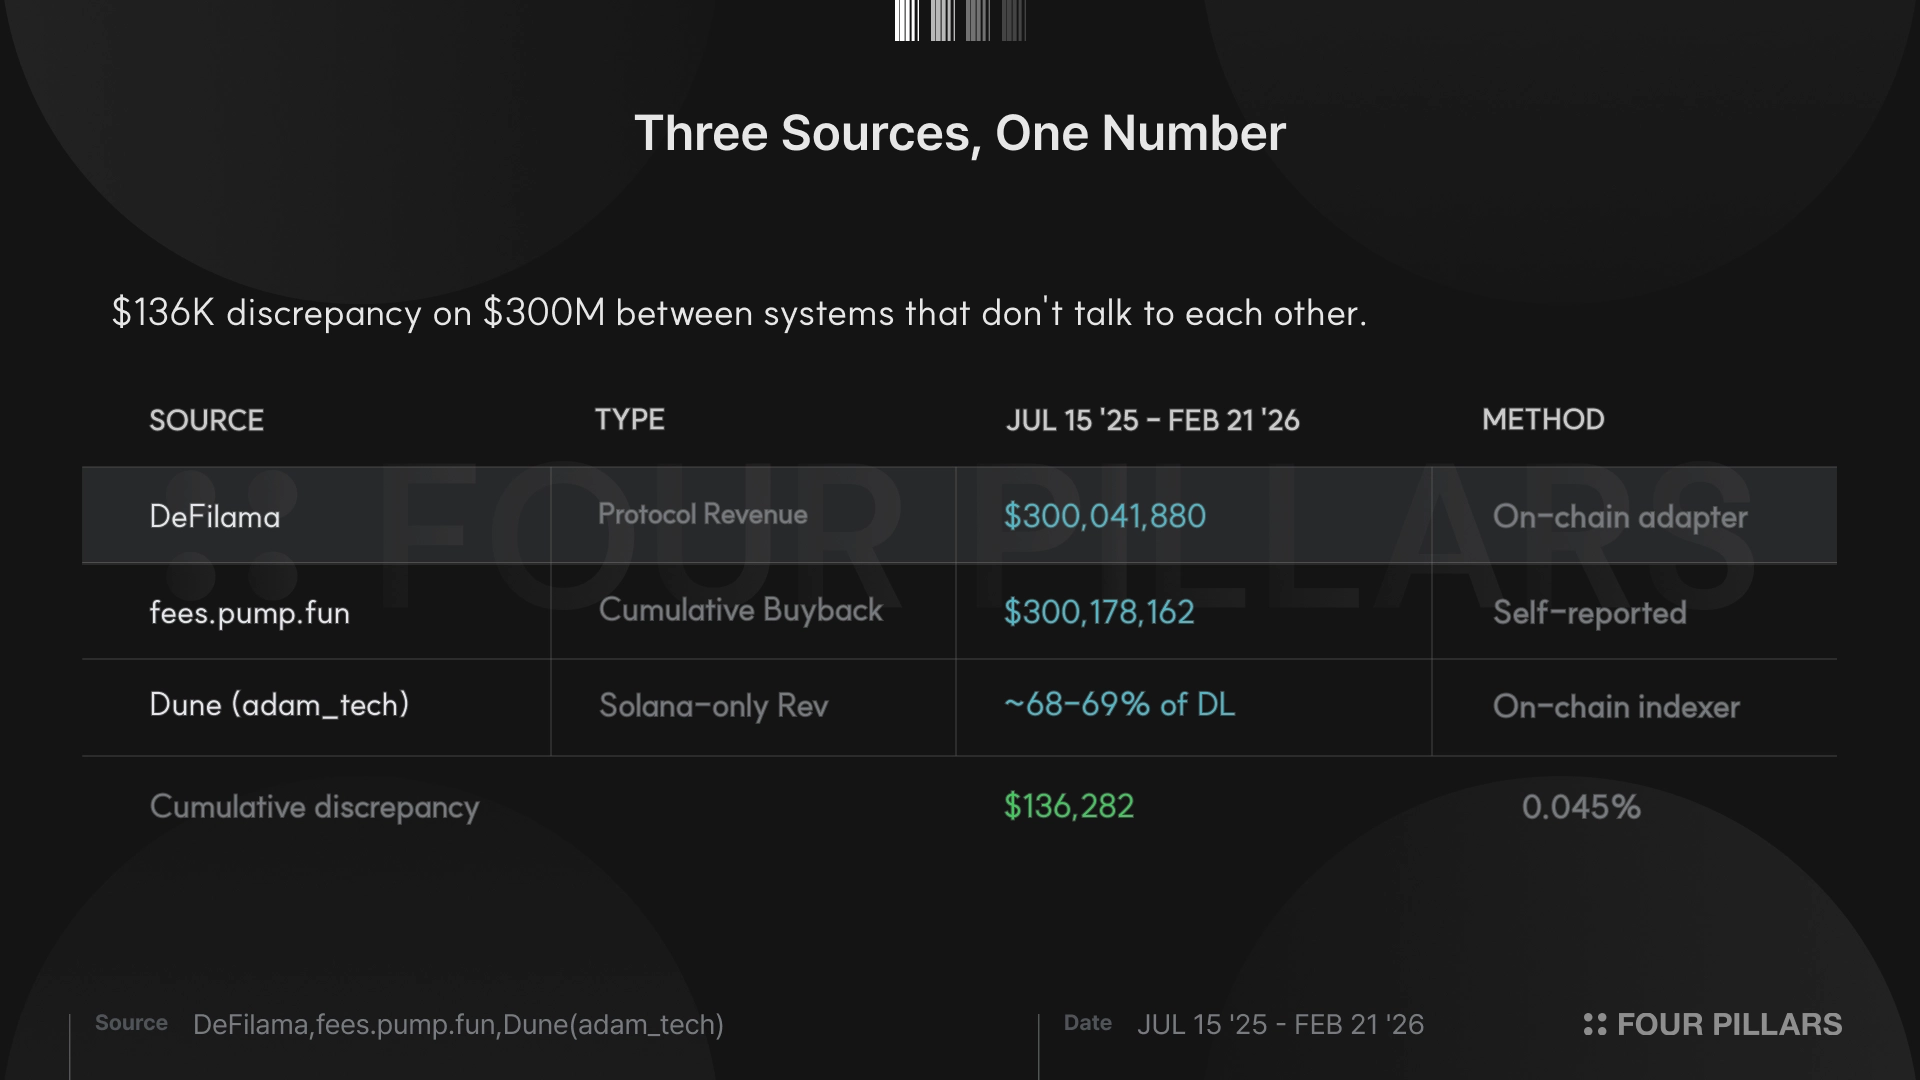
Before PumpSwap launched in March 2025, all three sources agreed within 1-5%. After PumpSwap, three layers emerged (total fees, then protocol revenue, then Solana-only). Fabricating this would require building a revenue stream that simultaneously fools two independent on-chain indexers, maintaining stable cross-ratios through three product changes, preserving the exact multi-chain split you’d expect from a real expansion, and backing it all with verifiable token purchases into identified wallets.
Physical evidence aside, 747 days of fee data submit to four standard tests for financial fabrication. No single test is conclusive in isolation, but four converging on the same answer is a different proposition.
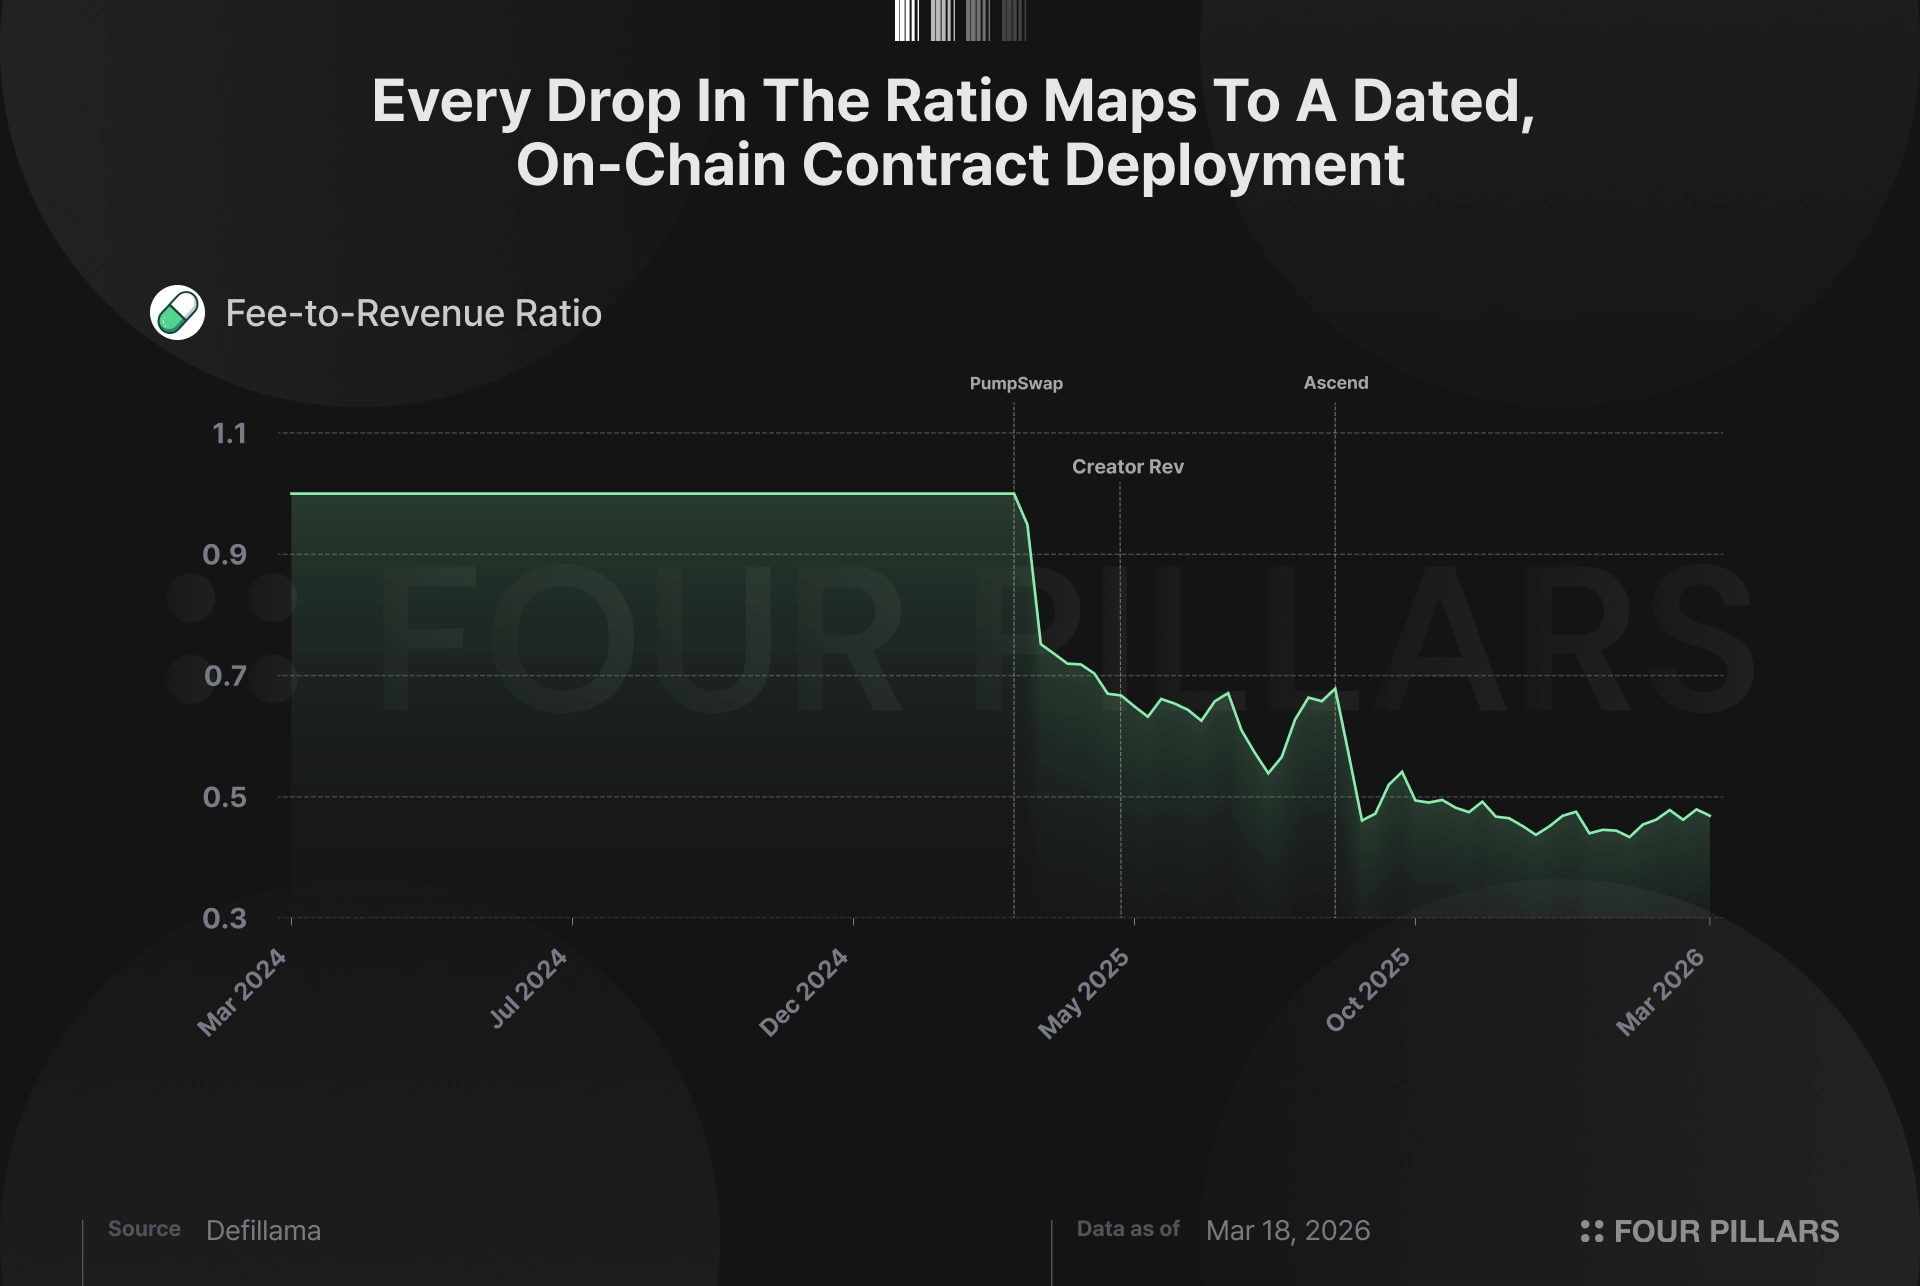
The fee-to-revenue ratio is the hardest test to fake, so let's start there. Pump.fun earns fees from every bonding curve transaction, but not all of those fees flow through as protocol revenue — some go to LPs, creators, and referral payouts. That ratio between total fees and net revenue declined from 1.0 to roughly 0.48 over the dataset, but not gradually. It dropped in three distinct steps, and each one maps to a dated, on-chain product change.
PumpSwap's LP fee split on March 20, 2025 pulled the ratio from 1.00 to 0.70 in two days. Creator revenue sharing on May 13 moved it from 0.69 to 0.56. Project Ascend's dynamic fees on September 2-3 pushed it from 0.68 to 0.46, as tiered pricing gave creators up to 0.95% on low-mcap tokens while the protocol kept 0.05%. Think about what faking this would require: modeling both fee and revenue series in lockstep through three separate restructurings, each varying by daily token-tier mix, with a ratio that fluctuates between 0.40 and 0.55 depending on market conditions. The complexity is self-defeating. You don't fabricate structural breaks that match public contract deployments; you just build a product.
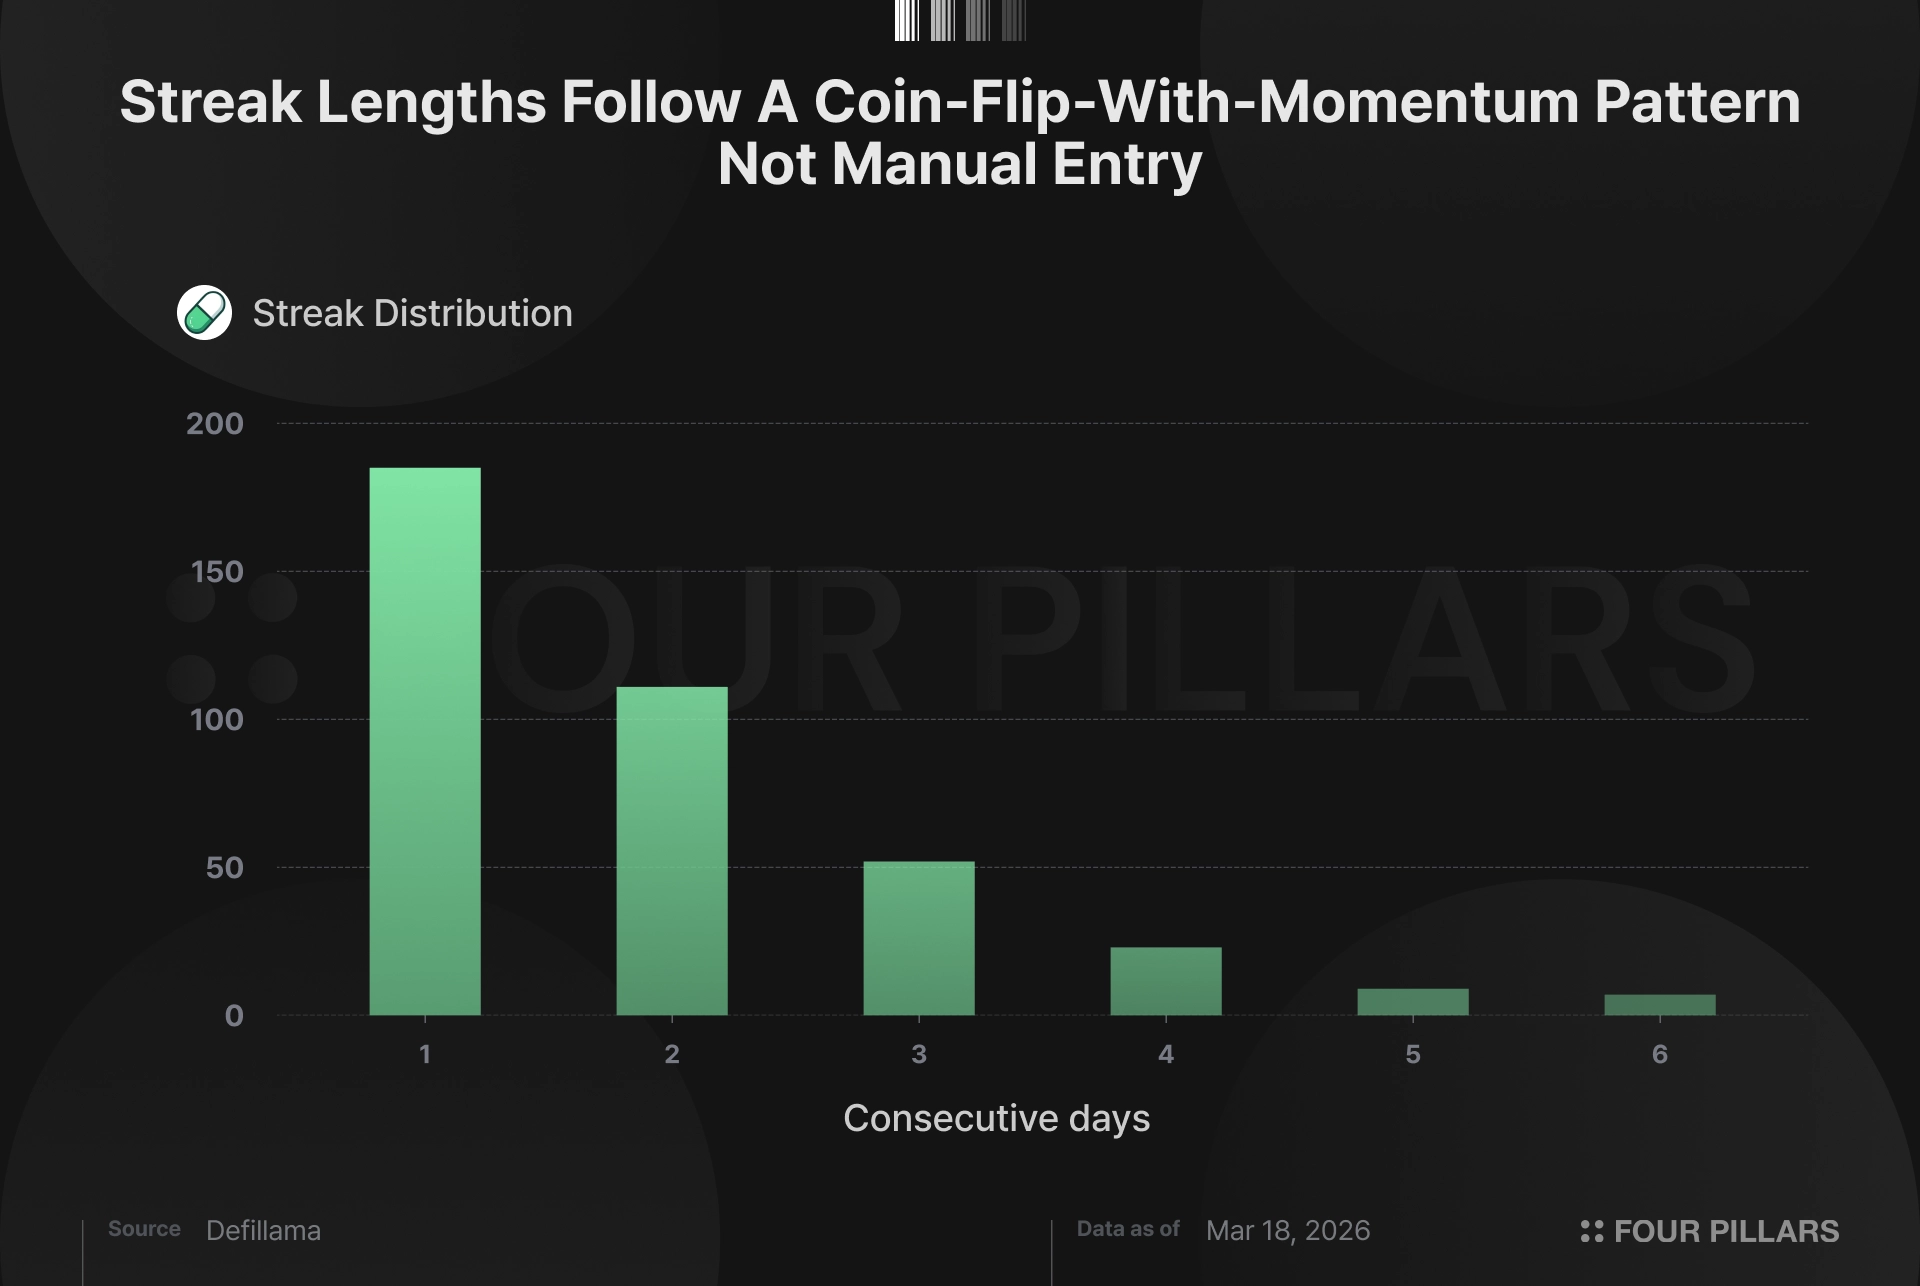
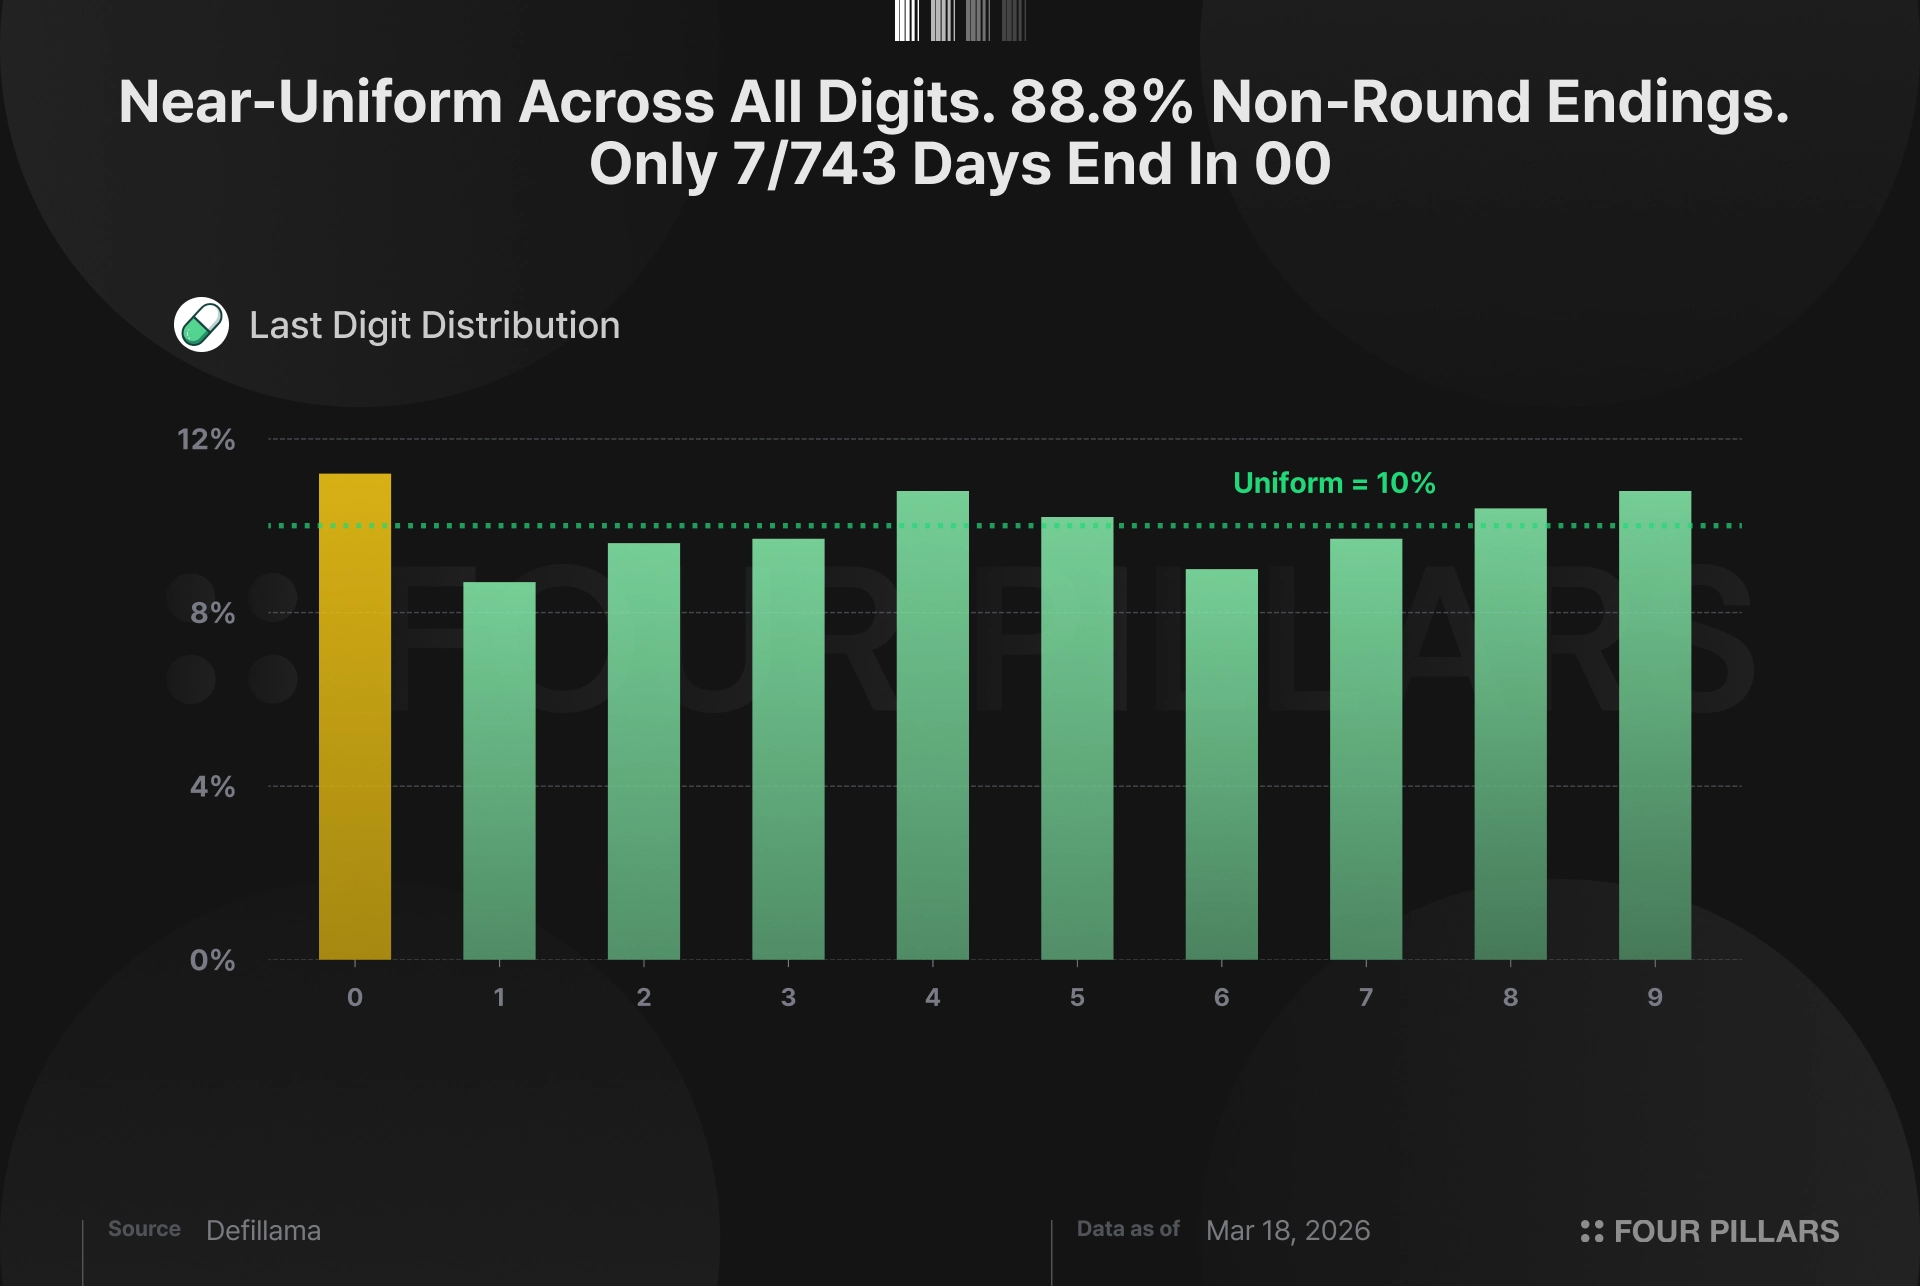
Next, the streak and digit tests, which asks “does this data look like a human typed it into a spreadsheet?” Humans are reliably terrible at generating realistic random sequences. We avoid long streaks, gravitate toward round numbers, and unconsciously favor certain digits. Pump.fun's data does none of this. The longest run of consecutive up or down days is 6, with an average streak length of 1.92; right where you'd expect from a natural process with moderate momentum. The distribution of streak lengths decays geometrically, from 185 single-day streaks, 111 two-day streaks, 52 three-day, all the way down to 7 six-day streaks. Regarding digits, the last digit of daily fees distributes near-uniformly between 0 and 9, ranging from 8.7% to 11.2% per digit. 88.8% of days end in non-round numbers. Only 7 out of 743 non-zero days end in 00 or 000.
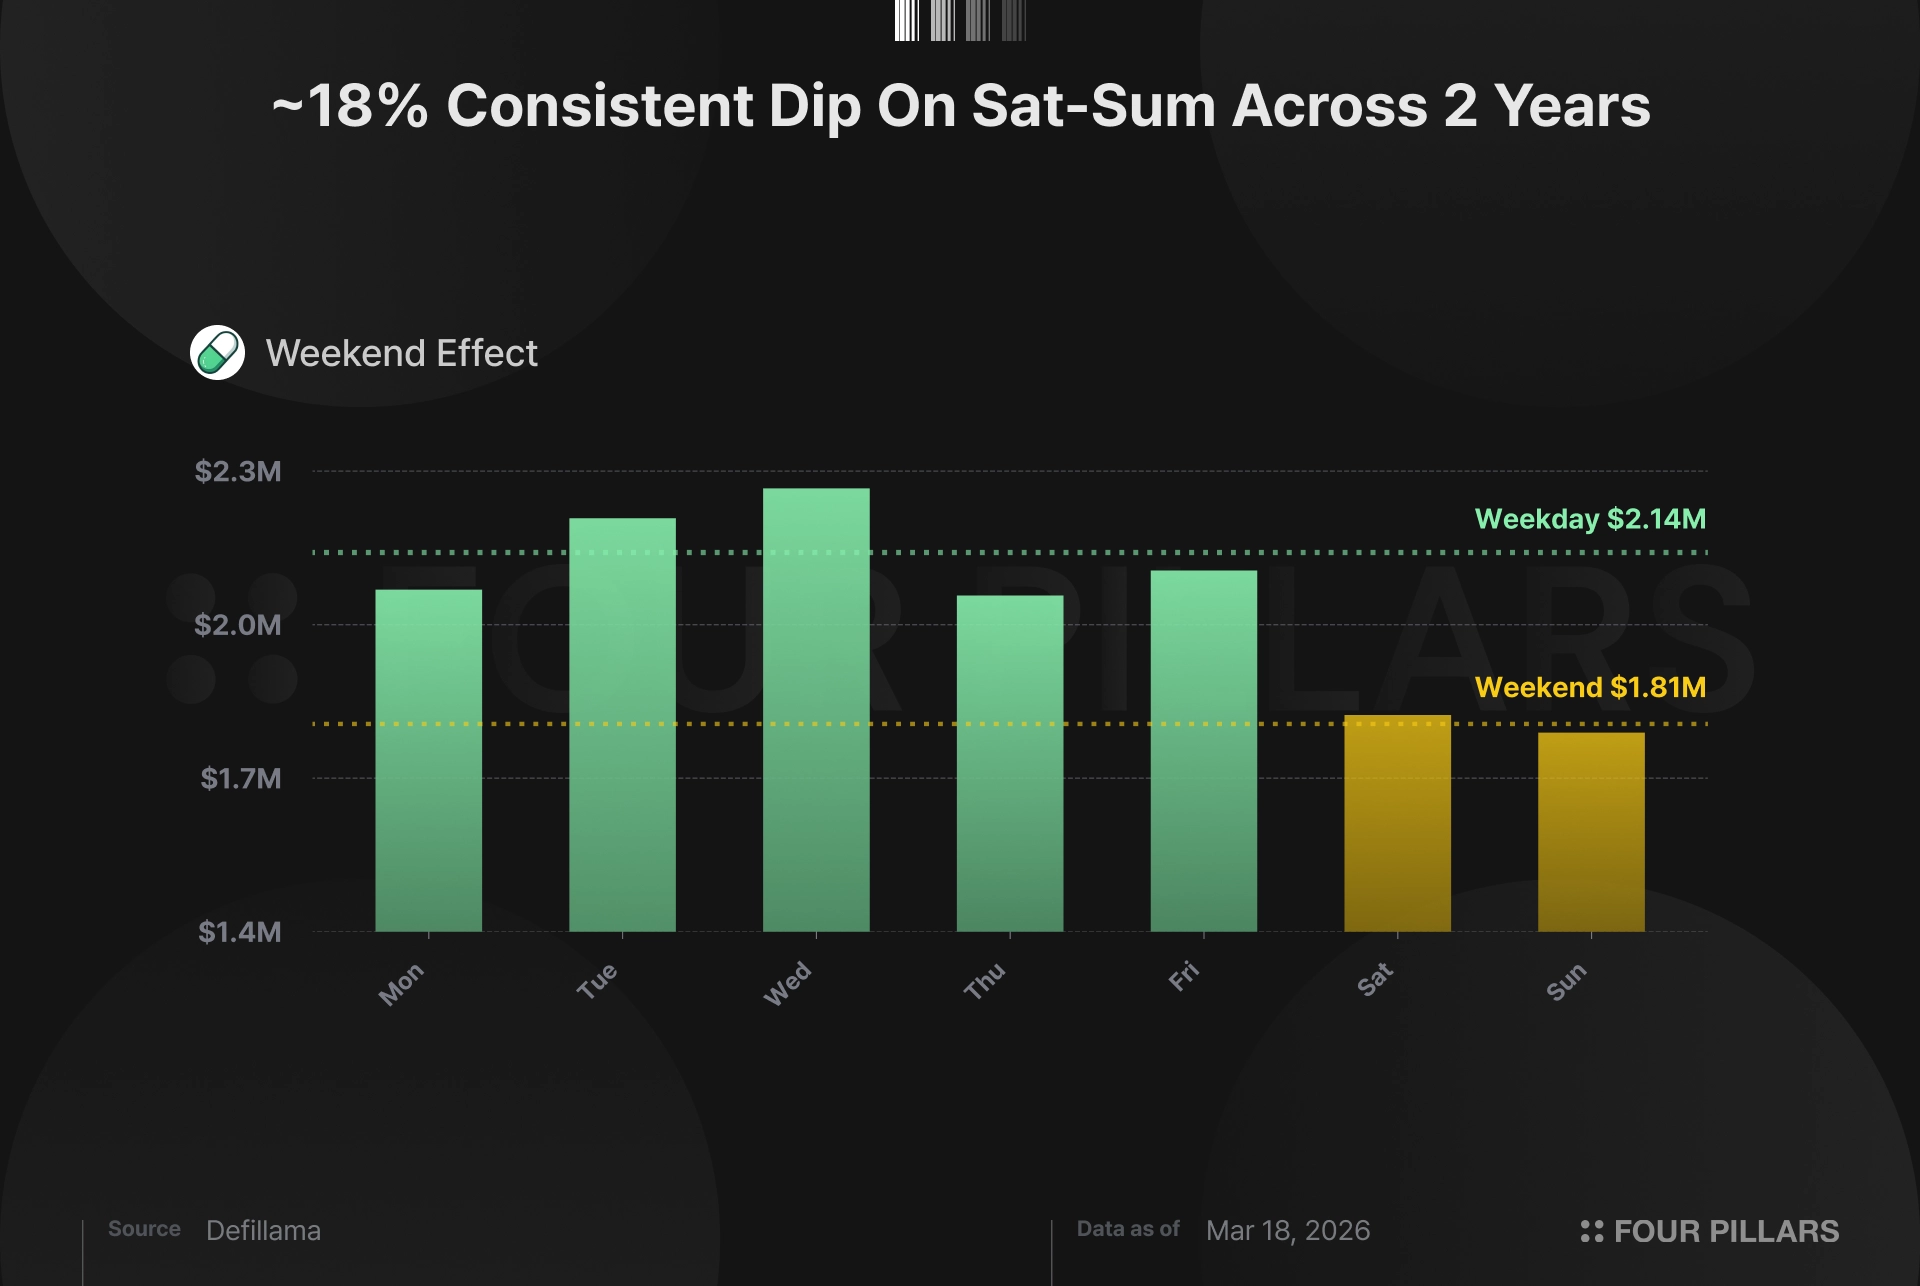
The weekend effect is intuitive. Pump.fun is a retail platform, meaning most people launch tokens when they're at their desks, not at brunch. Weekday fees average $2.14M versus $1.81M on weekends, a consistent ~18% dip that shows up week after week across two years of data. It's statistically significant (p = 0.003 on a Mann-Whitney test, for those keeping score). If someone were fabricating daily numbers, they'd need to remember to make weekends consistently lower. Not impossible, but it's one more thing a faker has to get right while also getting everything else right simultaneously.
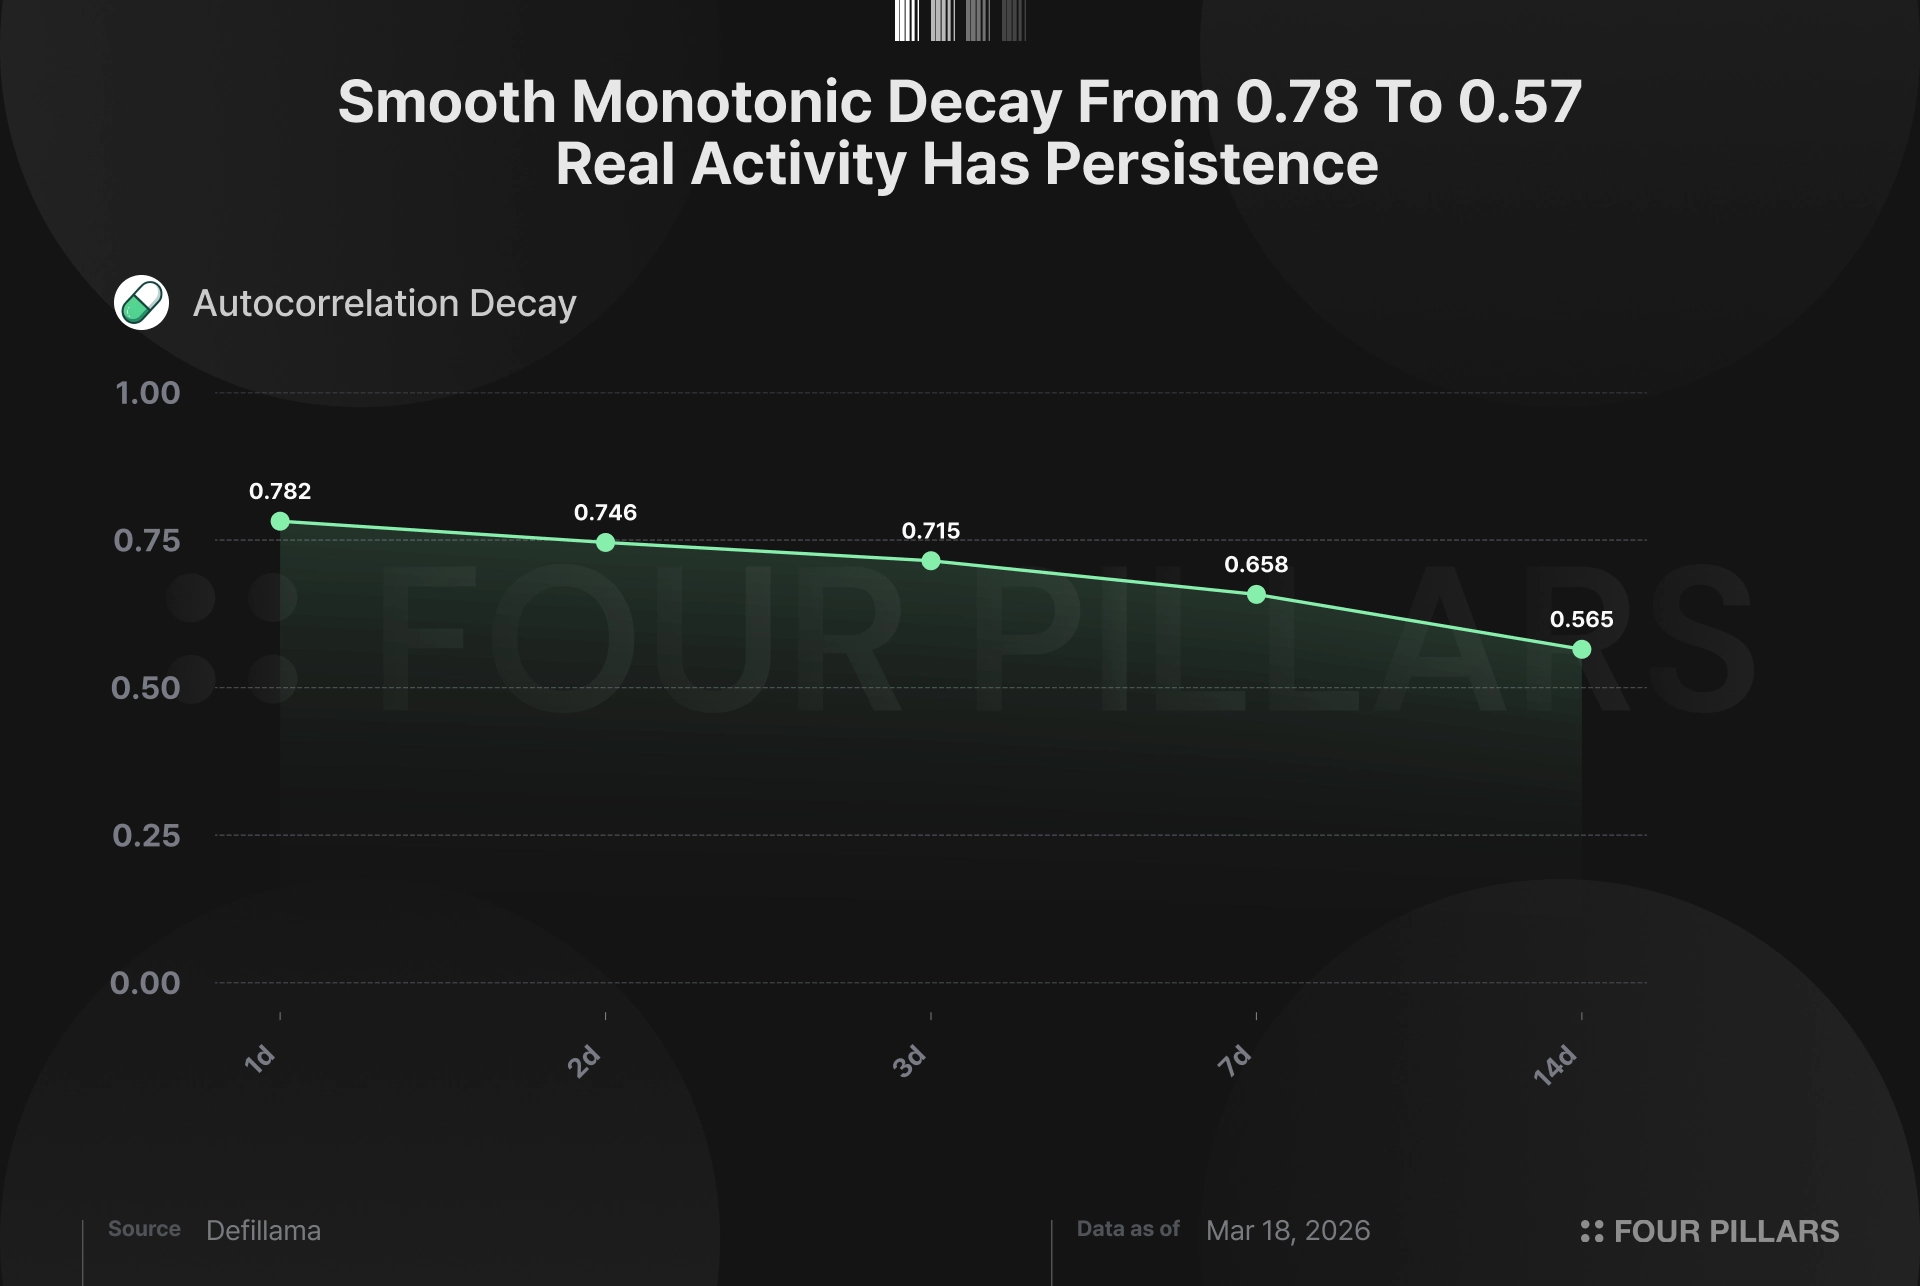
Autocorrelation measures whether today's revenue predicts tomorrow's. Pump.fun’s Lag-1 autocorrelation sits at 0.78, meaning today's fee number is 78% correlated with yesterday's. A week out (lag-7), it's still 0.65. Two weeks out (lag-14), 0.57. That slow, smooth decay is what organic platform activity looks like (good days cluster with good days, bad weeks bleed into the next). It's momentum. If you generated revenue by pulling random numbers from a hat each day, you'd get near-zero correlation between consecutive days. The data would jump around like noise instead of flowing like a market. Faking high autocorrelation at one specific lag isn't hard. Faking the entire decay structure, where each successive lag drops gradually and monotonically, while simultaneously preserving weekend effects, streak behavior, and realistic digit distributions? That's a different problem entirely.
Four independent methods, four consistent answers. Three sources that agree. The revenue is organic.
The revenue manipulation narrative is one of the reasons PUMP trades where it does. Sections 1 and 2 should put that to rest. But the token still trades at a discount, so what else is holding it down, and how much of it is true?
Start with the August team unlocks, because that's the easiest to debunk. Community emissions running at 10B/month stop at 240B in July, right when team and investor vesting starts at a combined 9.2B/month. Monthly emissions go from 10B to 9.2B, and inflation decreases 8%. At current revenue of roughly $1.25M/day, monthly buybacks of roughly $38M absorb ~2x the $19M in new monthly supply at $0.0021 per token, and that ratio improves post-August because emissions decrease while buyback pace holds.
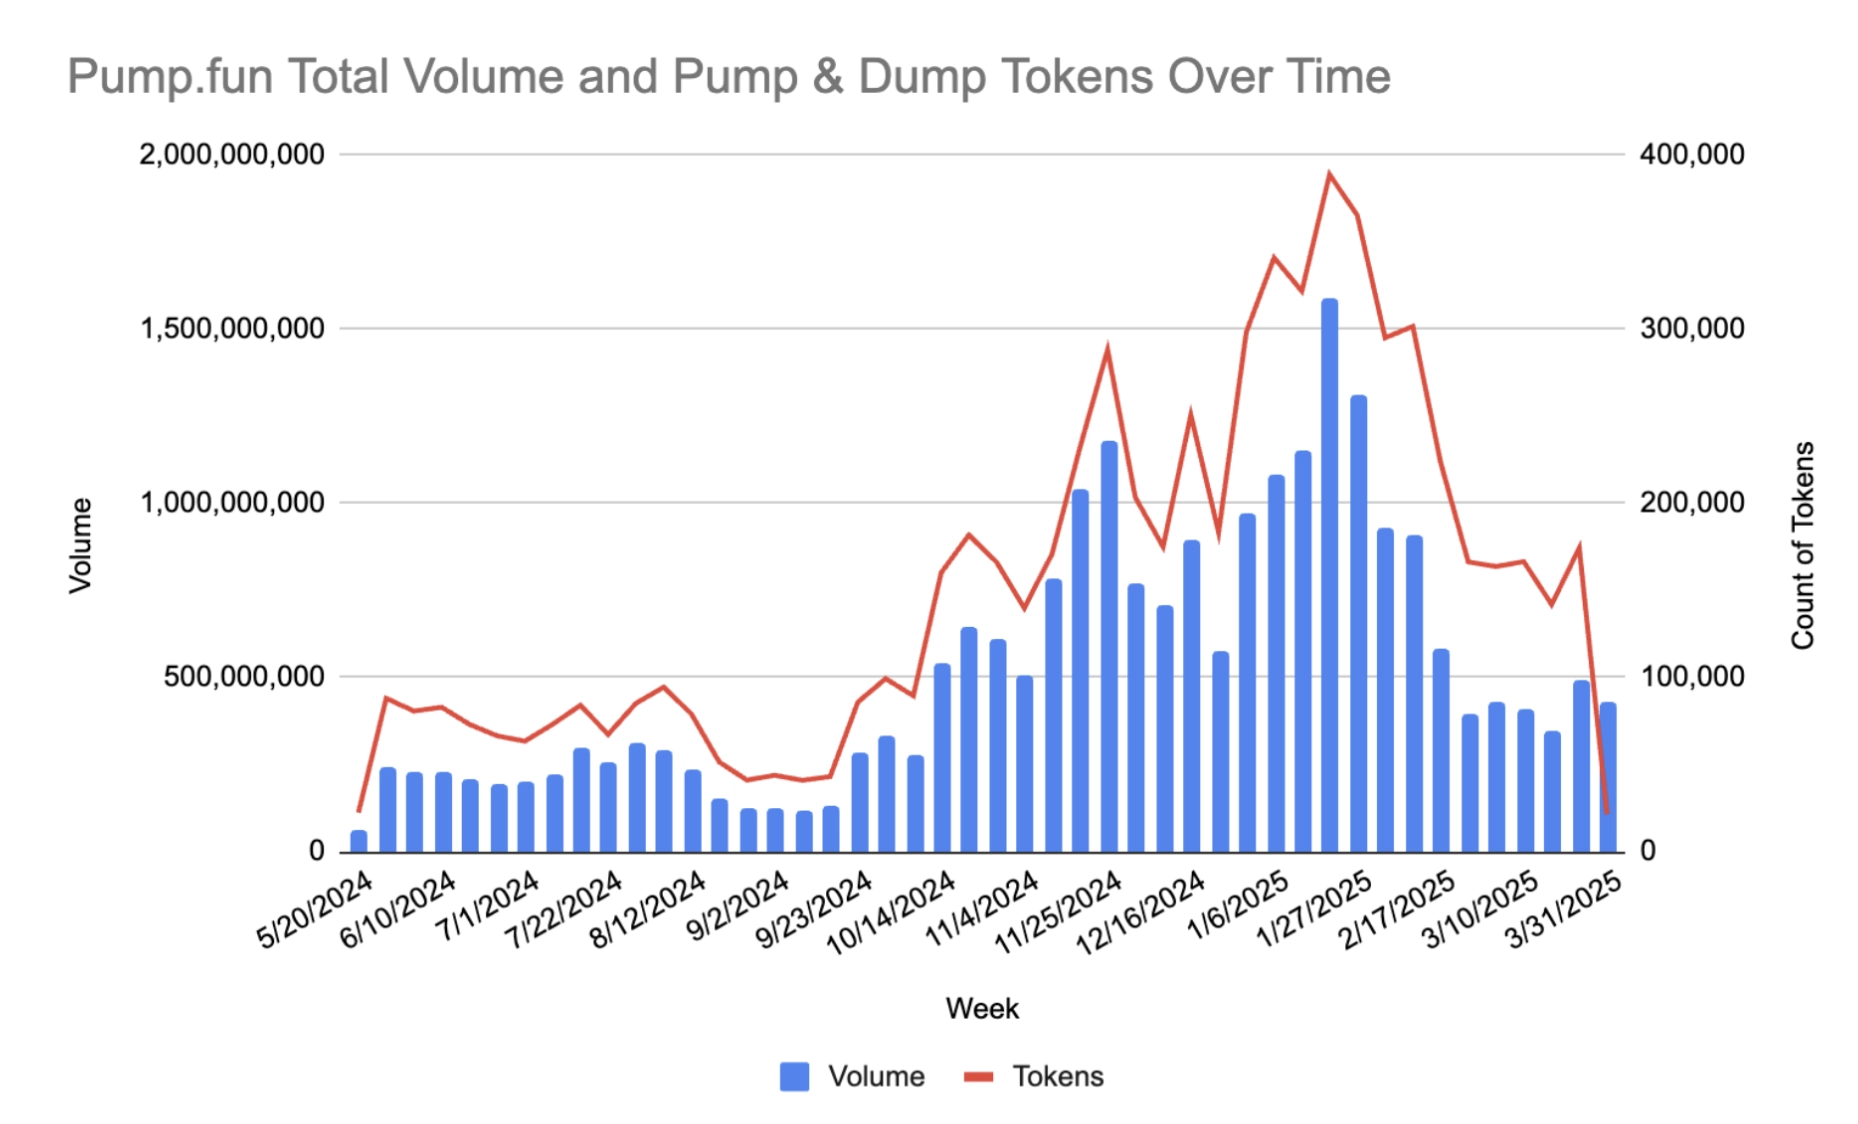
Revenue isn’t declining either. Monthly average fees have oscillated between $2.3-4.8M/day for 14 months. July 2025 dipped 49%, August bounced 94%, September ripped 72%, January 2026 surged 45%. Mean-reverting around $2.5-3M with weekly volume stable at $640-700M. The “Q3-to-Q1 decline” cherry-picks from a September spike.
So what remains?
The “sin stock” discount is the most durable. Solidus Labs’ finding that 98.6% of tokens on the platform show rug-pull behavior does what it’s designed to do: institutional allocators won’t touch memecoin casino as a line item regardless of what the revenue looks like. That’s persistent, structural, and completely unrelated to revenue quality.
Source: Solidus Labs

Alleged insider selling is tangible near-term pressure. Wallet 77DsB received 3.75B PUMP from a Solscan-labeled “Token Custodian Wallet” in July 2025 and allegedly liquidated for $8.02M USDC over February 16-22, 2026. Wallet GpCfm moved 1.21B ($2.57M) to Bitget the same week. A third wallet deposited 1.757B ($3.54M) to Bitget on March 6. No source confirms actual ownership, but at least $14M in 30 days flowing to exchanges at $0.002 against a $0.004 private round while the protocol buys back tokens is not a good look regardless of who owns the wallets.
Lastly there’s the trust layer, which is the hardest to price. Founders are pseudonymous (co-founder Dylan has a 2017 rugpull on record), the buyback is explicitly discretionary (“pump.fun may modify or discontinue those plans at any time”). Hayden Davis was linked to a $50M private sale allocation by Bubblemaps before the claim was deleted after co-founder Alon called it “defamatory.” The on-chain link exists, but the attribution is contested, not confirmed.
None of these are about the business. The revenue is real, the data confirm it, and the unlock schedule actually favors holders. The sin stock label, the pseudonymous founders, the insider flow — these are trust discounts on a protocol generating $1.25M/day in verifiable, on-chain revenue with a buyback absorbing 2x new supply. I believe trust discounts compress, but revenue at this scale doesn't stay mispriced forever.
Dive into 'Narratives' that will be important in the next year