In the crypto market, platforms that provide metrics of attention can largely be divided into two types. One is social based platforms, which can capture fast trends but carry the risk of information distortion; the other is on-chain based platforms, which provide reliable on-chain data but are difficult to use intuitively.
Signal by Layer3 is an on-chain based attention indexer that emerged to bridge this gap. Instead of simply counting mentions, it provides an attention index based on actual on-chain activity to measure participation efficiency, showing how effectively a project’s campaigns or marketing strategies lead to user acquisition.
Through this, exchanges can discover potential projects early, project teams can measure marketing ROI with precision, and investors can make rational decisions based on tangible growth indicators. Furthermore, Signal plans to expand its ecosystem with premium services and data APIs, and the attention index has the potential to establish itself as a new standard metric for user participation efficiency in Web3.
In the cryptocurrency market, high-quality attention information plays a crucial role that goes beyond simple news—it supports decision-making in marketing strategies, new asset listings, and even multi-billion-dollar investment decisions. Market participants, facing uncertainty, are constantly seeking “Alpha,” that is, information that gives them an edge over others.
To meet this demand, a variety of Web3 information aggregation and analysis tools have emerged. Currently, there are two main pillars leading the direction of capturing and providing metrics of attention within the crypto ecosystem. One is the social based case, which shows the flow of market interest in an almost real-time and intuitive manner; the other is the on-chain data based case, which precisely tracks actual behavior and capital flows through on-chain data.
Kaito, classified as part of the InfoFi sector, is an information platform that collects and indexes various Web3 content using AI. From sources that are difficult to capture at a glance through traditional search engines—such as social media, governance forums, research, news, podcasts, and conference presentations—it automatically extracts narratives, topics, and ticker information, making them searchable and trackable.
Through this, users can quickly grasp market narratives and flows of attention related to specific projects or themes, while also solving the problem of fragmented information. Additionally, Kaito encourages information sharing and content creation by users through tokenized attention models like “Yap-to-Earn.”
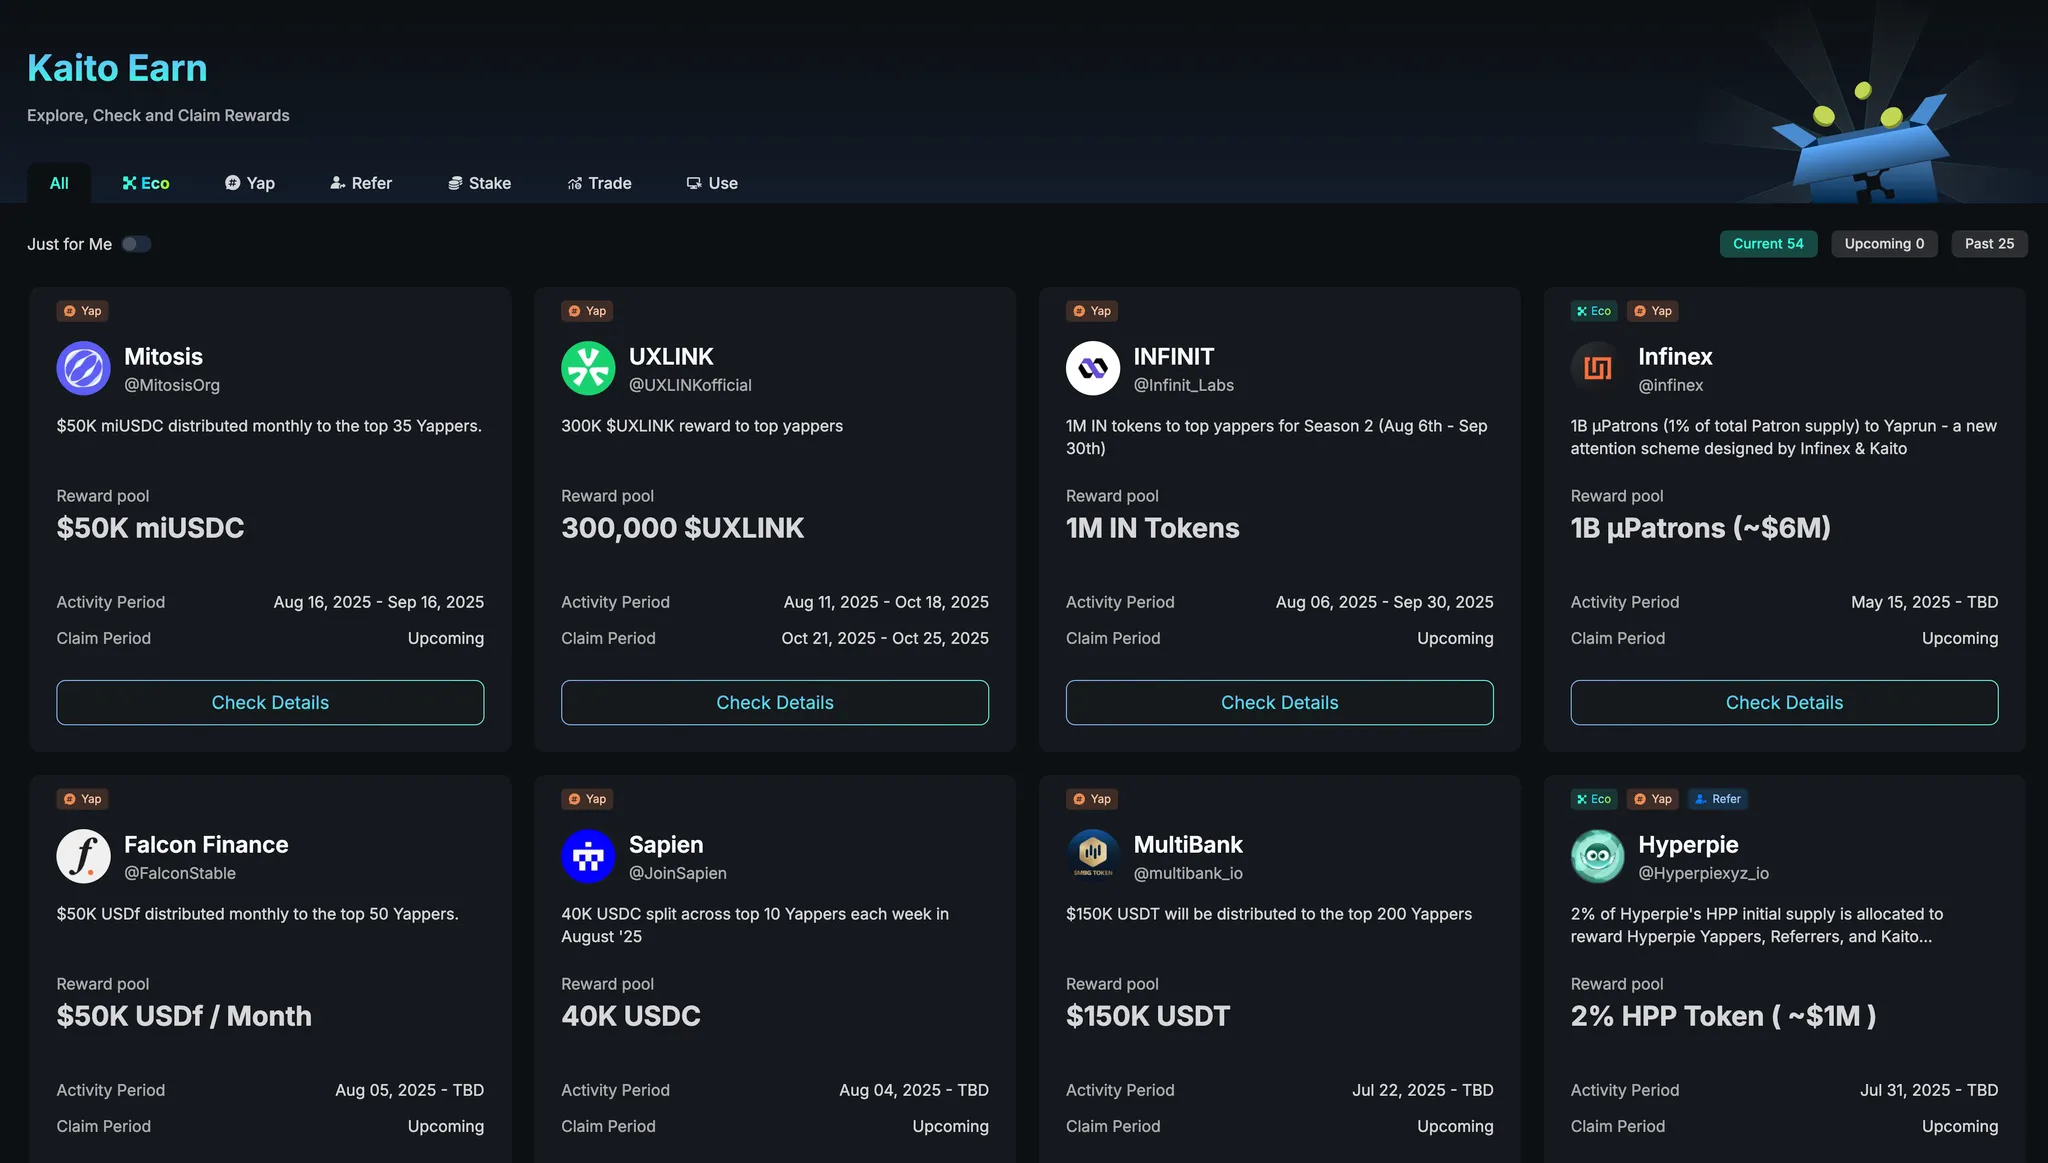
Source: yaps.kaito.ai
Paradoxically, however, this very reward mechanism can also become the system’s biggest weakness: the problem of information pollution. Kaito’s Yap-to-Earn model, when abused by participants seeking to maximize rewards, can trigger the generation of indiscriminate AI-produced spam content or meaningless farming activities. This leads to the measurement of artificially inflated engagement, rather than genuine community interest, which in turn causes users to doubt the reliability of the metrics they encounter. Although Kaito is certainly making efforts to solve this issue of information pollution, the battle between offense and defense is likely to continue.
As a result, a “disconnect from actual behavior” can occur. The number of mentions, likes, or pieces of content on social media does not guarantee that users will actually open their wallets to use a protocol or generate on-chain transactions. In other words, “everyone is talking about it” does not mean “everyone is using it.” Decision-making based on this assumption inherently carries risks.
Another area is the on-chain data based case, characterized by the fact that it provides verified on-chain data. Since records on the blockchain—such as transactions, wallet movements, and contract calls—are immutable, these platforms can deliver data that directly reflects users’ on-chain activity.
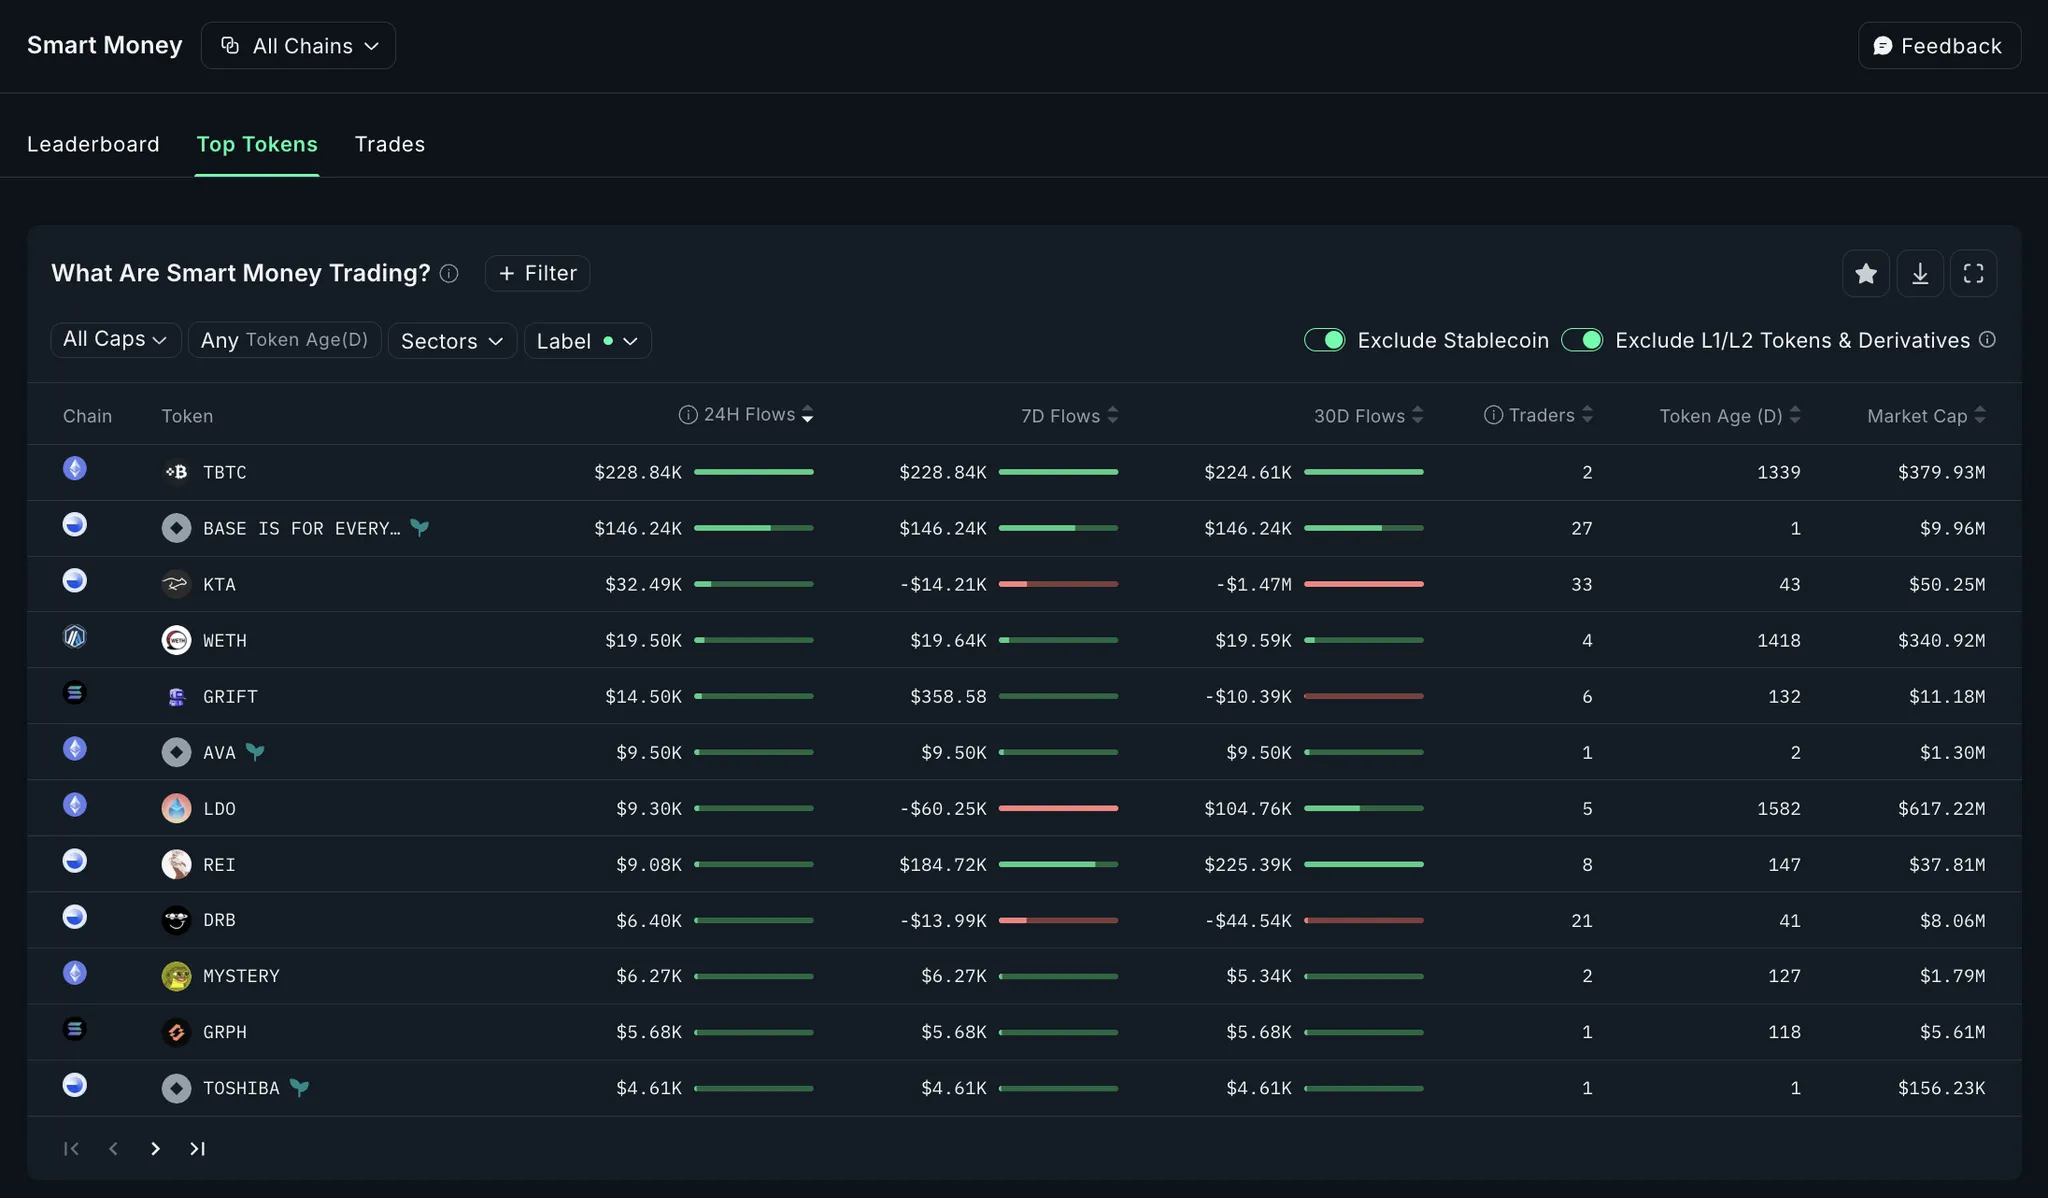
Source: nansen.ai
For example, Nansen reprocesses on-chain data by assigning labels such as “Smart Money,” “Whale,” “Venture Capital (VC),” or “Exchange” to blockchain wallet addresses. This allows users to track the flow of funds, portfolio changes, and trading activities of crypto players hidden behind anonymous addresses.
Similarly, Artemis is a platform that focuses on fundamental data, enabling blockchains and dApps to be analyzed like companies. It provides data points similar to those used in traditional financial valuation, such as Daily Active Addresses, transaction counts, protocol revenue and fees, and Total Value Locked (TVL).
However, properly leveraging these tools requires a high level of expertise. On-chain analytics platforms like Nansen and Artemis go beyond simple usage—extracting meaningful insights from raw data demands a deep understanding of blockchain structures and market mechanisms.
In today’s crypto information analysis market, there exists a gap between “quick trend detection” and “accurate reflection of real usage.” Social based data is attractive because it quickly shows which issues are gaining traction in the market, but it has limitations in terms of actual relevance to projects and reliability. Interaction metrics such as likes, impressions, or follower counts are only superficial numbers that can easily be distorted.
For example, users often leave reciprocal reactions on each other’s posts—simply exchanging “GM (Good Morning)” greetings or emojis just to earn points, regardless of the actual informational value. Such interaction metrics can be easily inflated, ultimately creating distortions in interpreting market trends.
On the other hand, on-chain data is considered a more reliable indicator, as it involves signatures, transactions, and fee payments—all of which require a certain cost and effort, making them hard to manipulate. However, the downside of on-chain information is that it is difficult to interpret from an average user’s perspective, and it often takes considerable time for analysis results to emerge, making it less effective for capturing overall trends in real time.
In this context, Layer3’s Signal approaches the gap from a new perspective. It provides fast and verifiable answers based on on-chain data to questions like: “Has the explosive attention on social media actually translated into on-chain activity?” and “What is the efficiency of that conversion?” Beyond mere trend detection, it quantifies and reveals the participation and actions of users engaged in reward based activities, enabling precise analysis of campaign effectiveness and user conversion rates—not just surface-level metrics.
Signal is a new analytical tool that evaluates user responsiveness to quest based campaigns, built on the vast on-chain activity data Layer3 has accumulated over the past three years through its quest based app. Rather than focusing merely on “how much participation a project received,” Signal emphasizes “how efficiently the project was able to drive participation.” In doing so, it delivers new on-chain based insights that existing analytical tools have overlooked.
Signal is built on the vast on-chain activity data accumulated by Layer3 over the past three years as an on-chain quest and rewards platform:
Over 3 million users who have paid fees at least once
More than 200 million attributed transactions
Over 60 million on-chain credentials
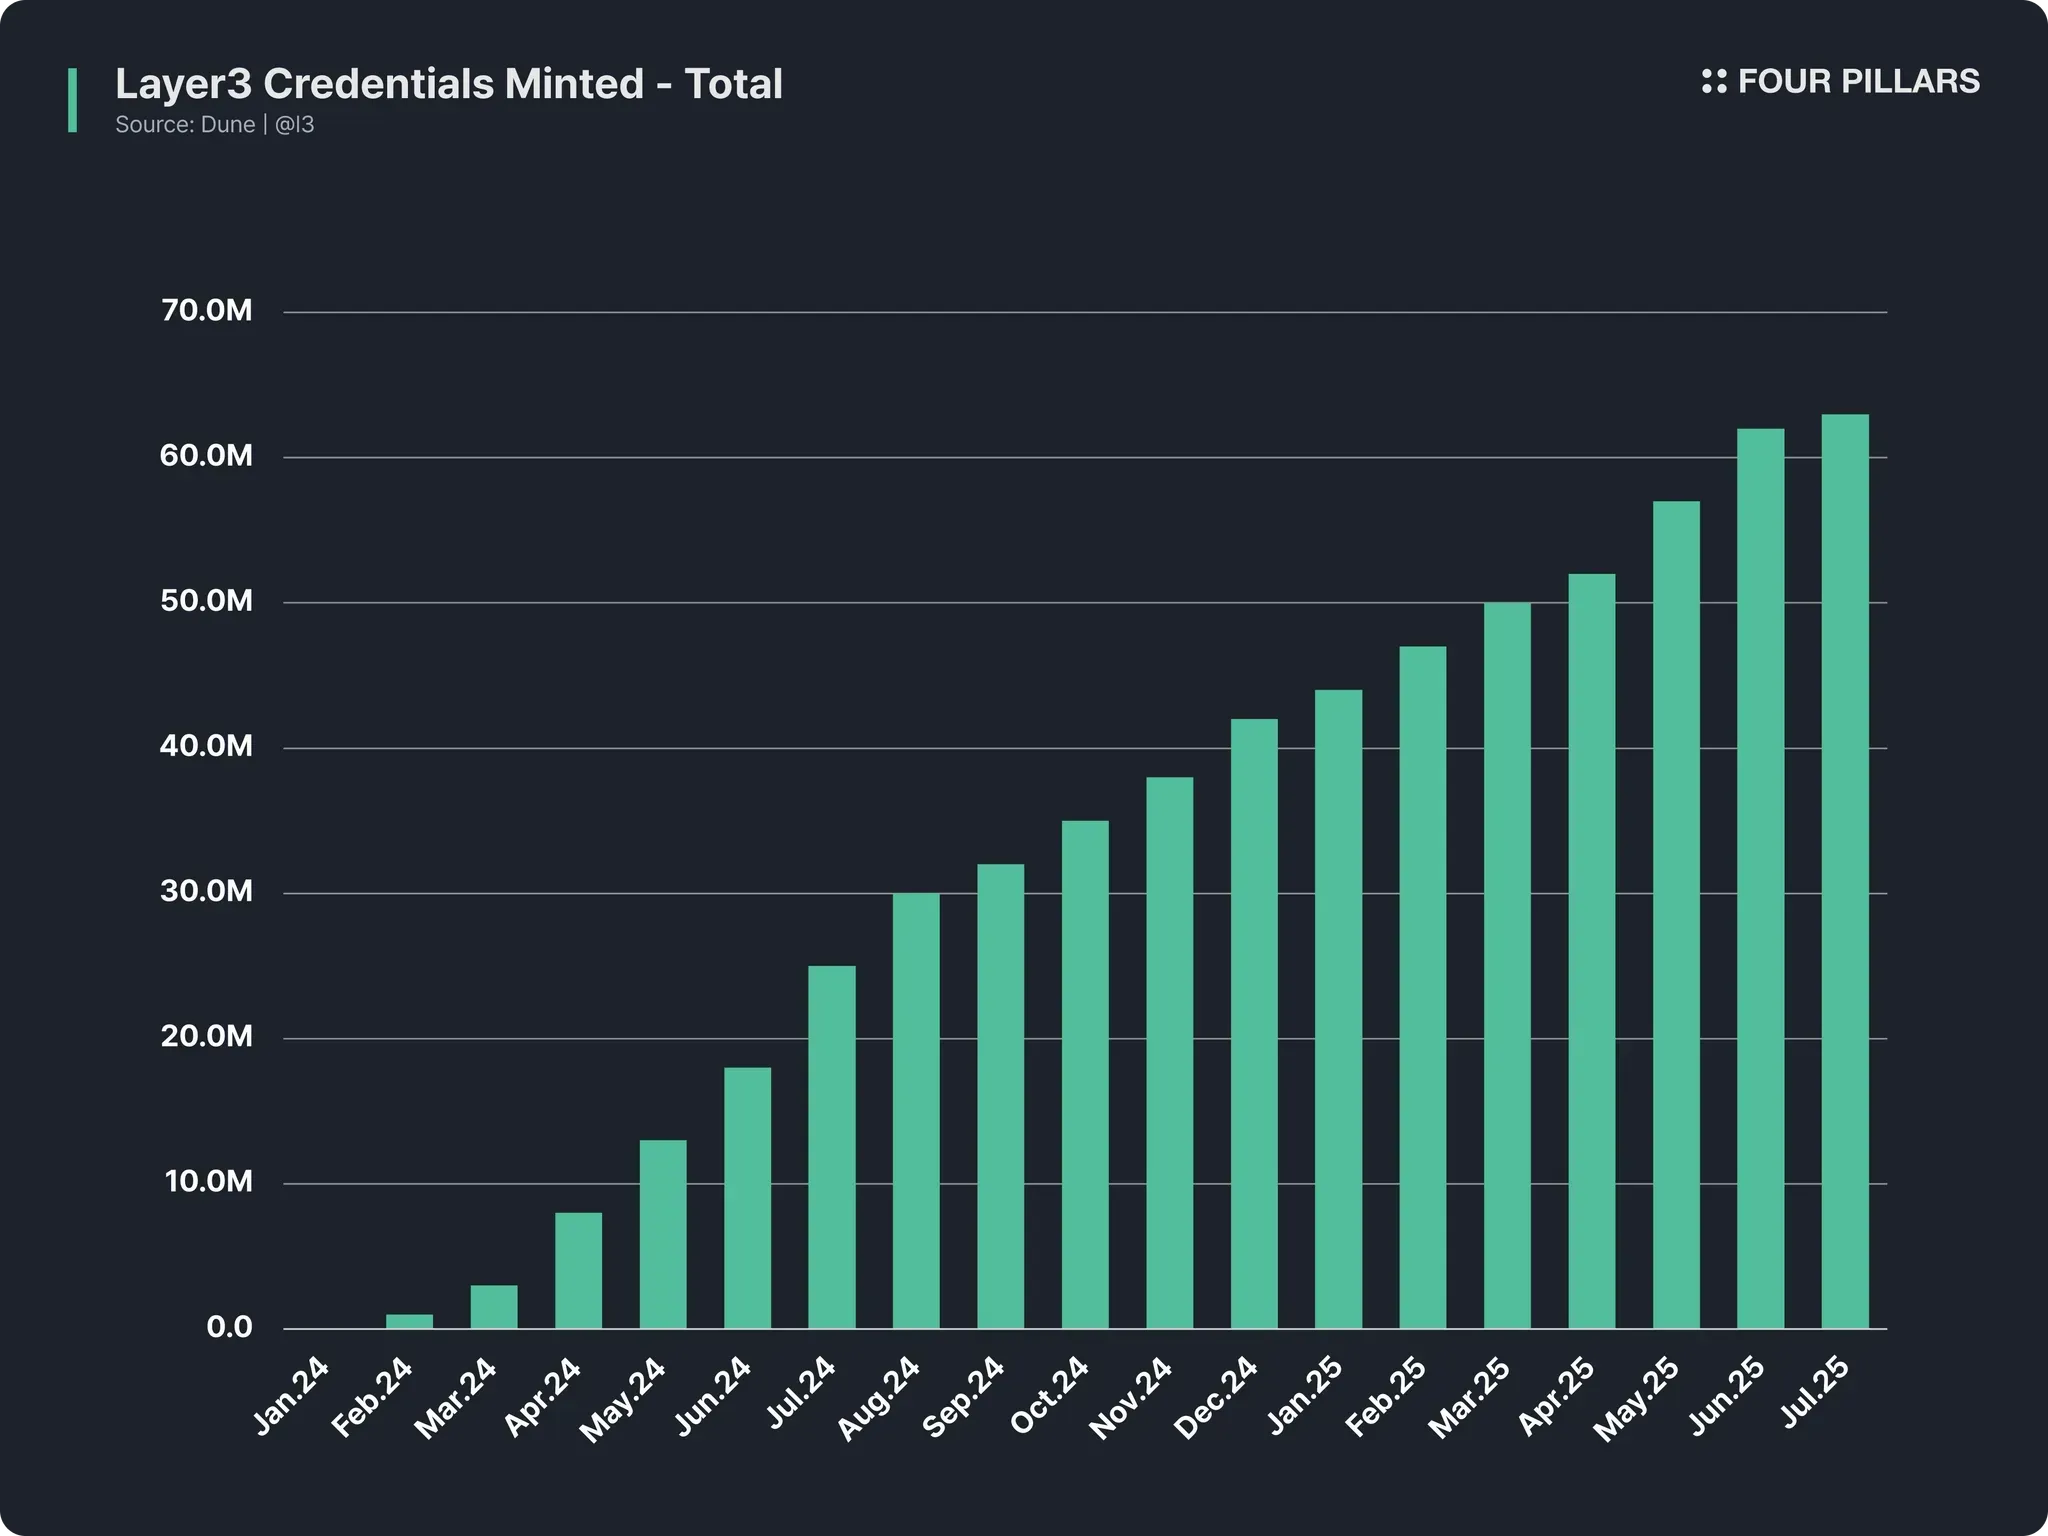
This data does not represent mere views or mentions—it reflects “intent-driven on-chain activity”, where users actually connected their wallets, paid gas fees, and interacted with specific protocols. Thanks to this characteristic of the underlying data, users can rely on Signal as a trustworthy analytical tool.
Signal aggregates user on-chain activity generated within Layer3’s action-reward structure, serving as a public scoreboard that shows which projects, blockchains, and communities are actually driving participation. Rather than simply counting the number of events or the volume of content, it ranks entities based on actual participation rates over a given period.
One key metric it provides is the “Onchain Relevance Index”. Unlike social metrics such as likes or followers, this index is based on tangible traces of user on-chain activity, such as wallet interactions, quest completions, and on-chain credentials.
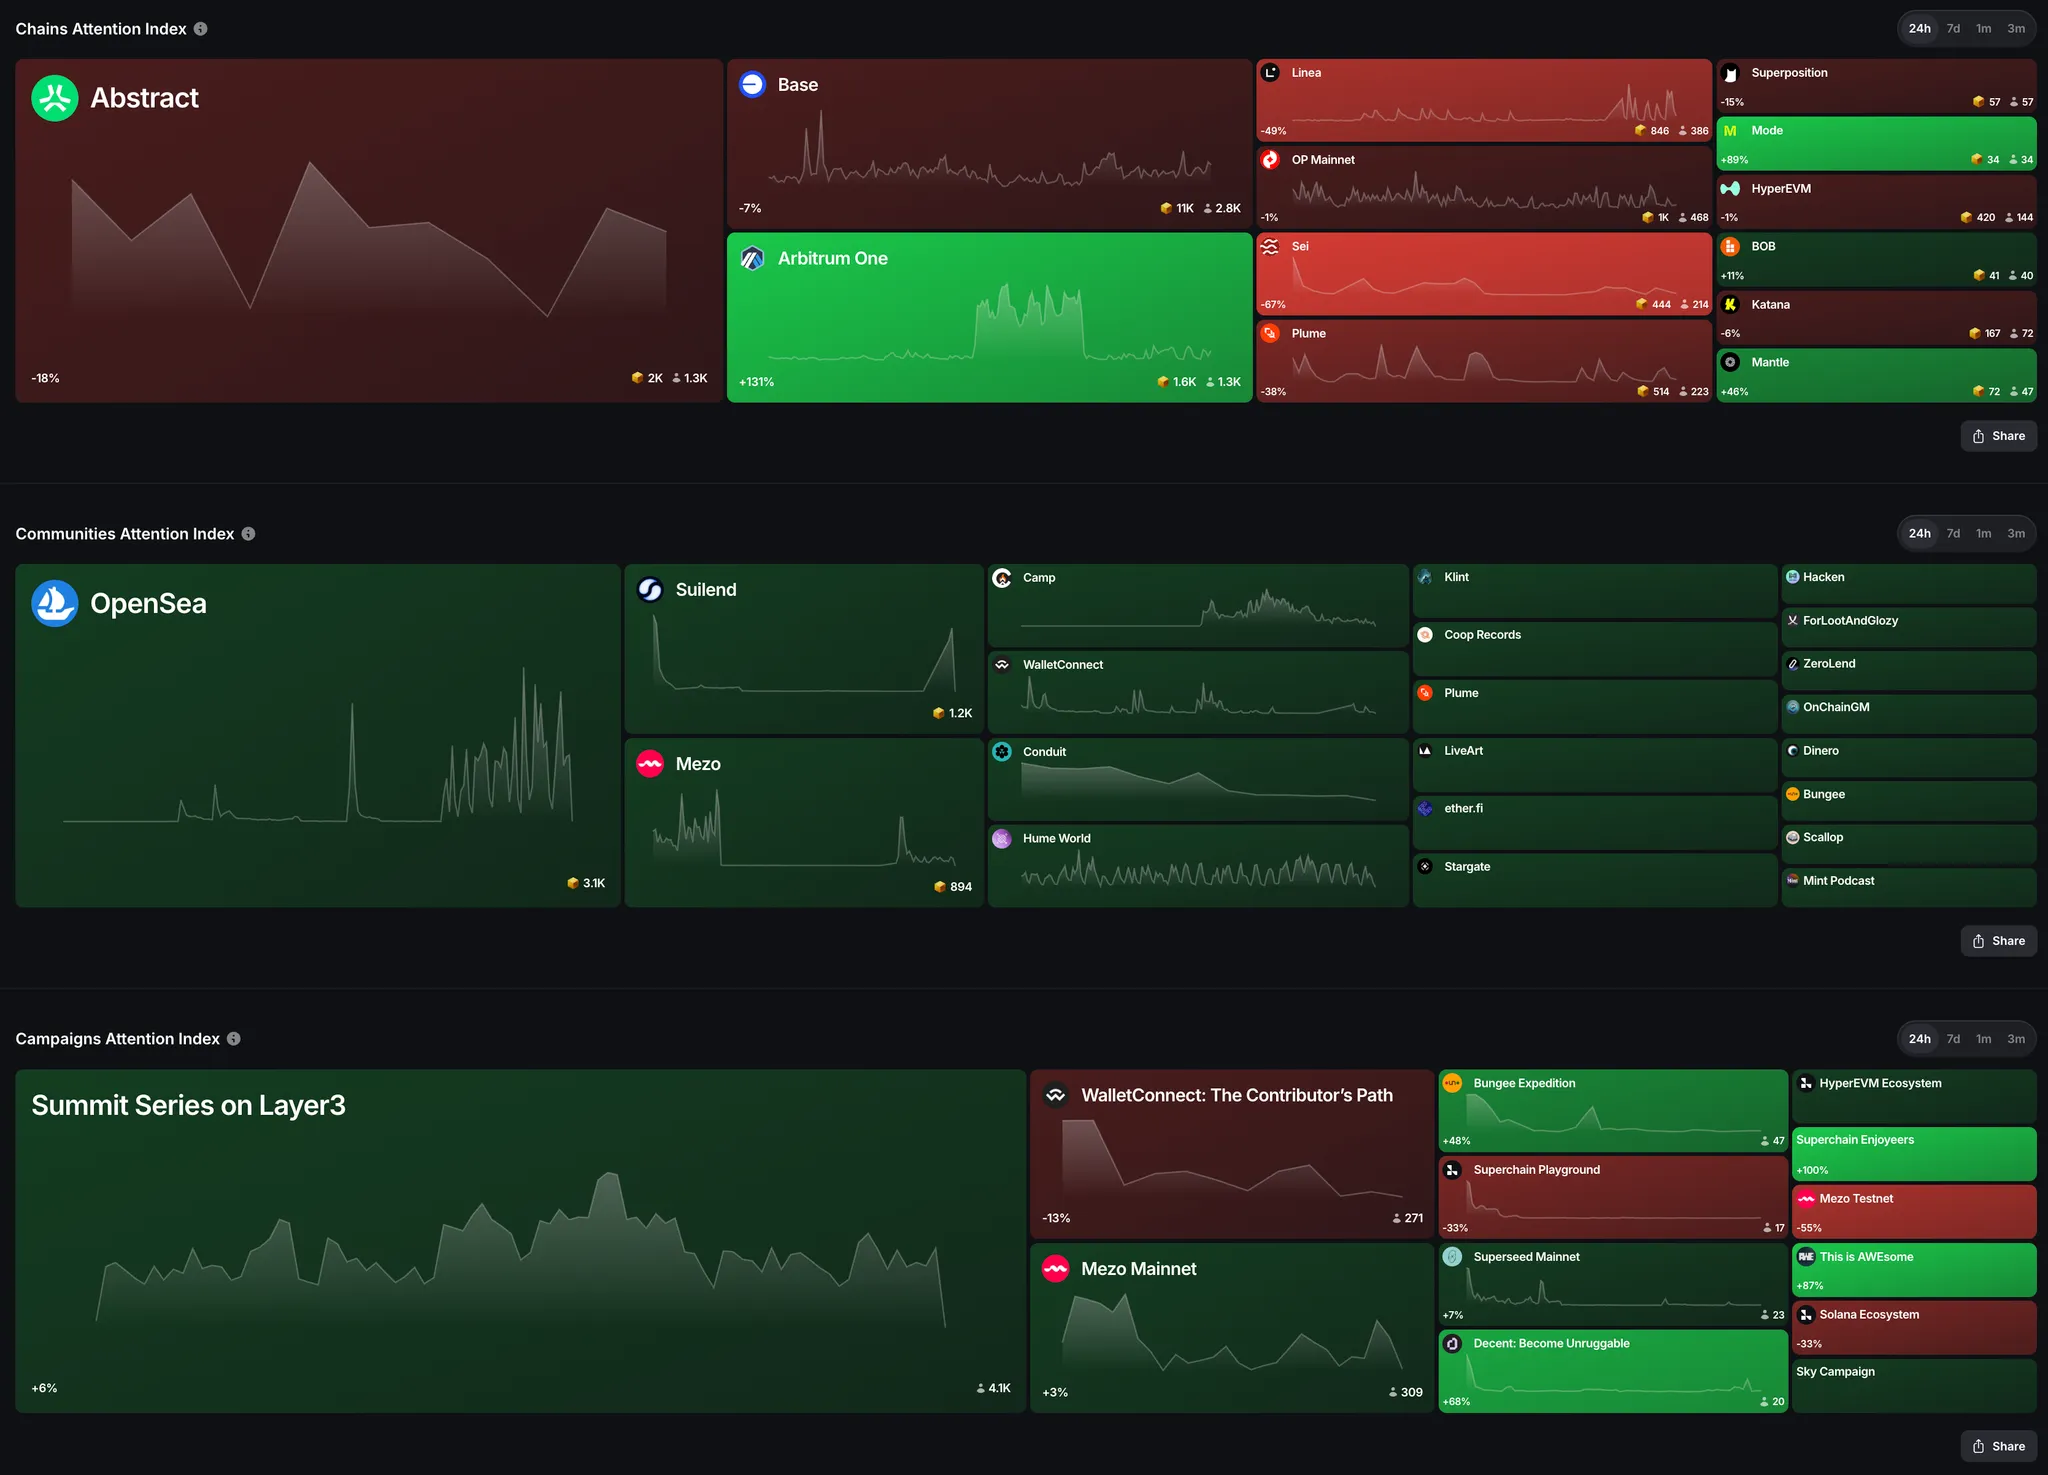
In addition, the Signal app offers both an “Attention Index” ****and a “Trending Board” at the level of blockchains, communities, and campaigns, allowing rankings to be tracked in real time according to actual participation rates. In this sense, Signal is not just a tool for measuring attention but a reliable analytical indicator rooted in real on-chain activity.
The core of Signal lies not in sheer participation volume but in “Participation Efficiency”. The key metric for this is the Attention Index, which is not based on how often a project is mentioned but instead on “CUBE minting records”—on-chain proof that users have actually completed quests.
In other words, this data-driven indicator reveals where the “genuine momentum” of a project’s ecosystem lies among Layer3 users. It goes a step beyond asking, “How many people talked about it?” and instead answers, “Out of those who heard about it, how many unique users actually opened their wallets and took action?”
The calculation of the Attention Index is straightforward: it divides the Share of Unique Participants a project attracted over a given period by the Share of Overall Activations the project conducted.
Attention Index = Share of Unique Participants / Share of Overall Activations
Let’s compare two projects as an example:
Project A: If Project A’s campaigns accounted for only 2% of all campaigns but attracted 10% of all unique participants, its Attention Index would be 5.0 (10% / 2%).
Project B: If Project B ran larger campaigns that made up 10% of all campaigns but attracted only 5% of unique participants, its Attention Index would be 0.5 (5% / 10%), which is relatively lower compared to Project A.
Source: Layer3 Signal
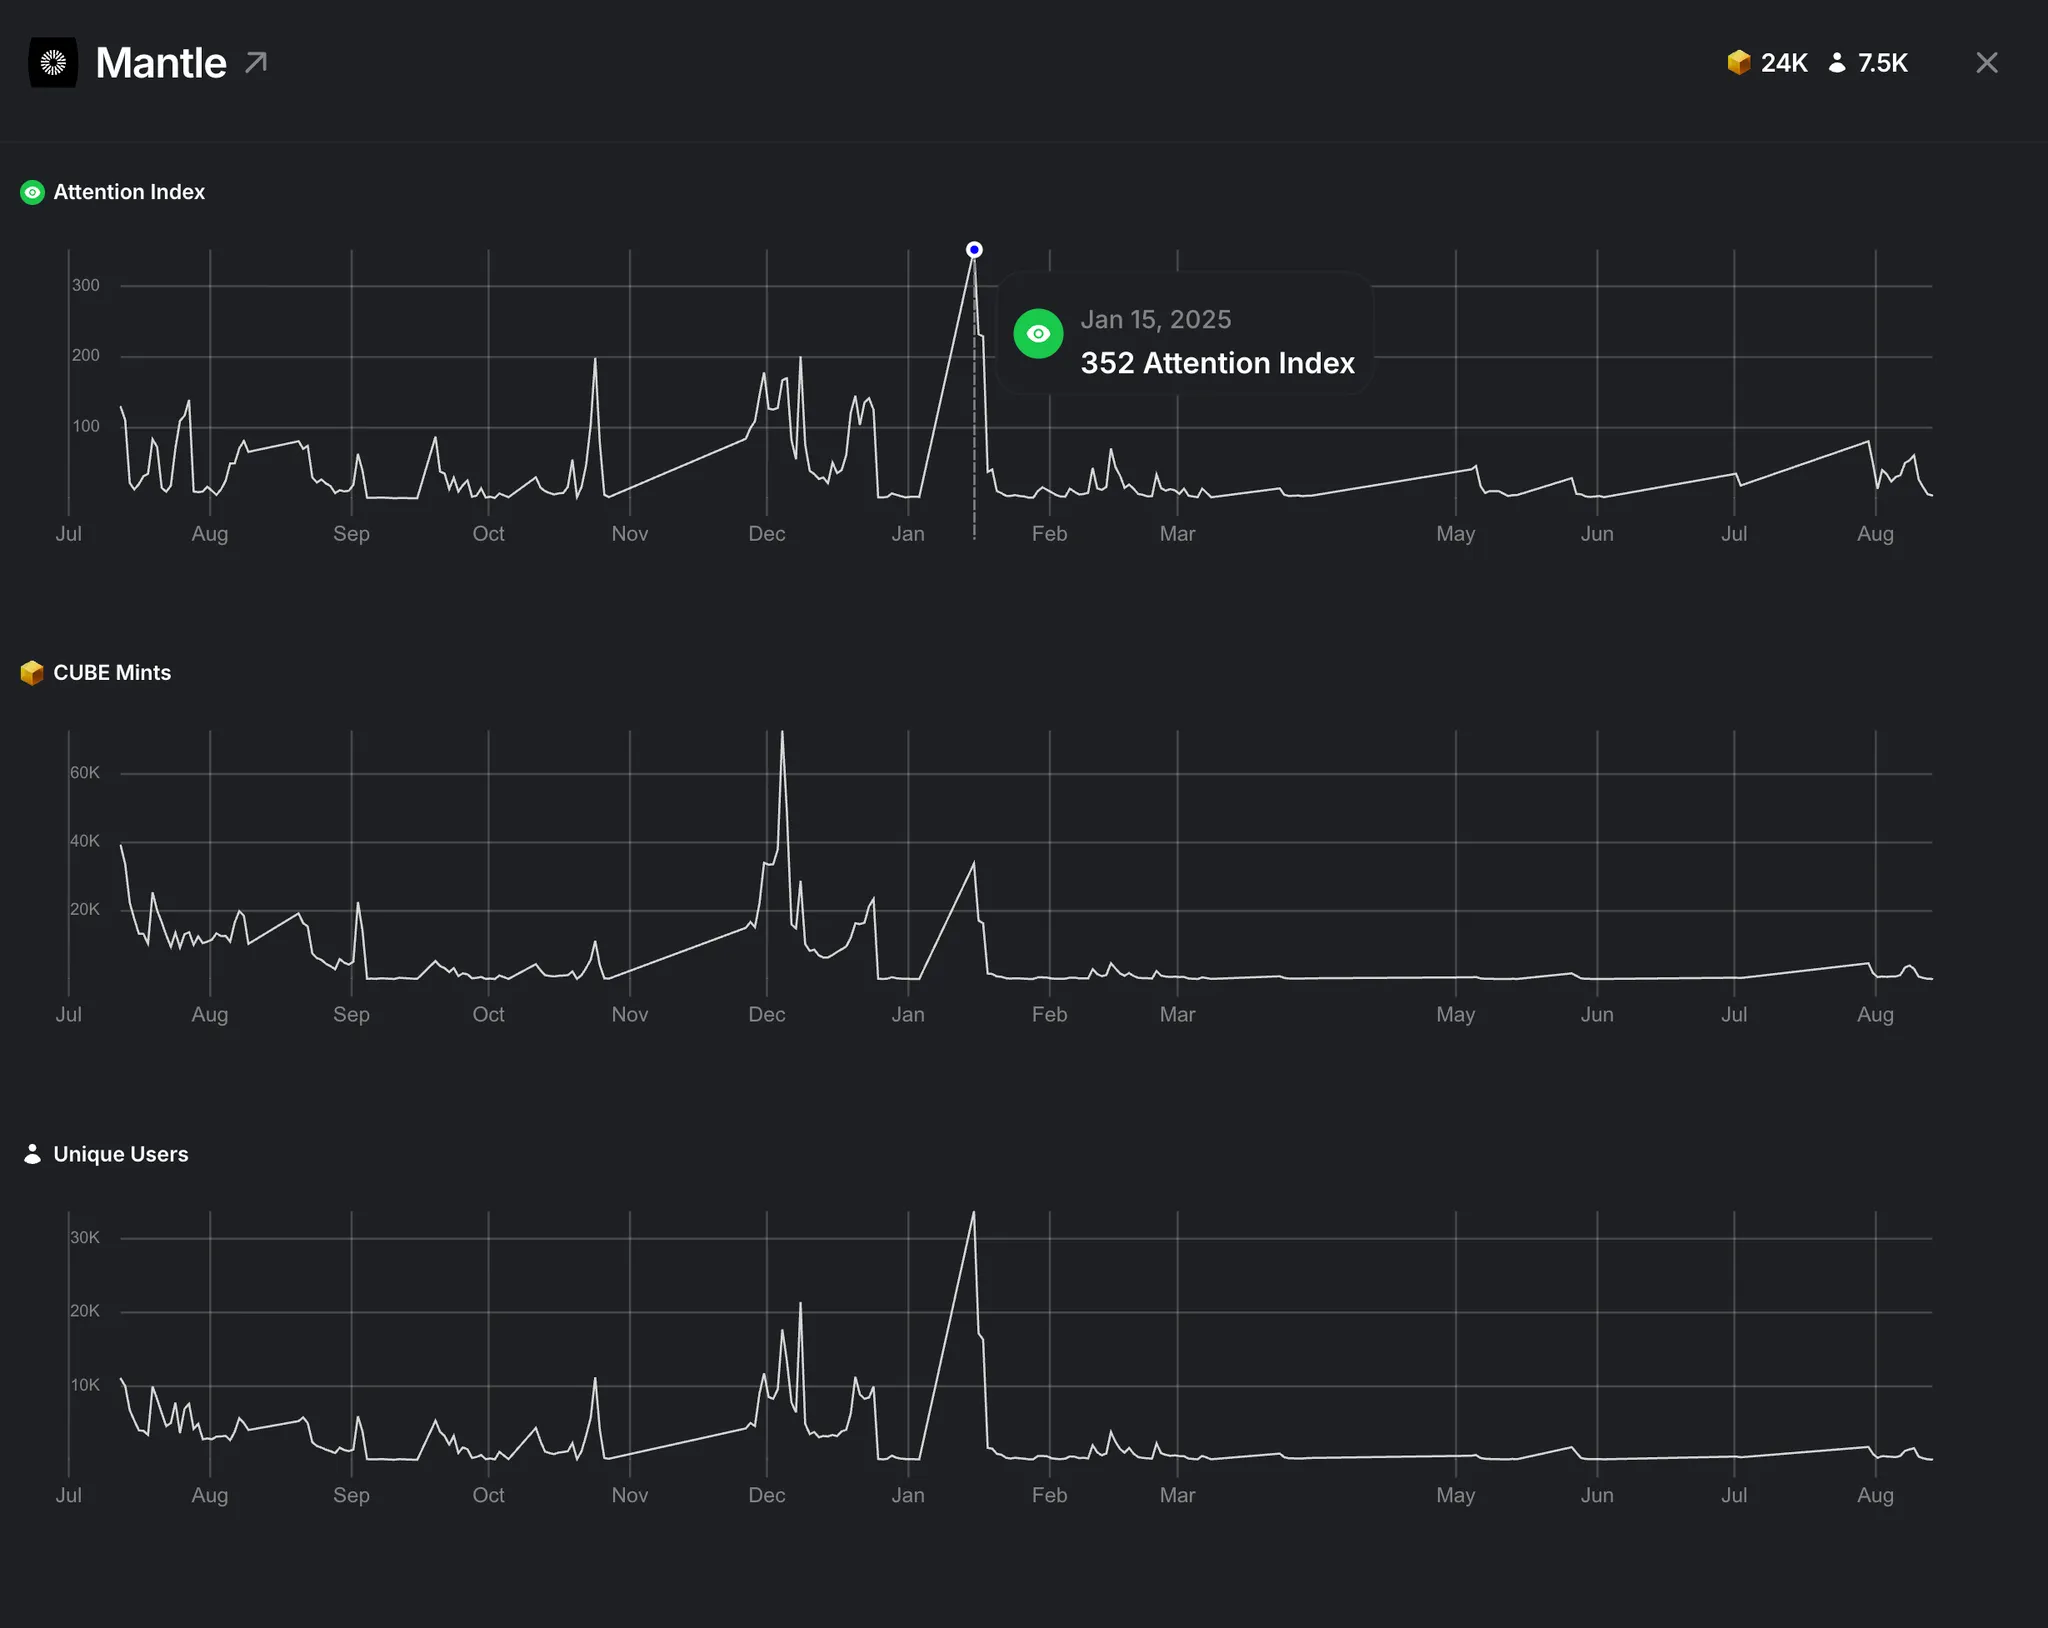
As of August 2025, looking at a one-month record of the Attention Index, Mantle holds the top spot. The reason Mantle achieved this was its ability to maintain an average Attention Index of 45 throughout the month, steadily driving users’ on-chain activity.
What’s especially notable is Mantle’s peak record on January 15, 2025, when it hit its highest Attention Index of the year. This spike was driven by Mantle’s airdrop campaign launched on Layer3, during which Mantle recorded an Attention Index of 352, with 33,825 CUBEs minted and 33,725 unique users participating. The campaign’s explosive reception led on-chain activity to peak, and this was directly reflected in the Attention Index. (The campaign is now inactive, as the participation period has ended.)

Source: Layer3 X
At this point, many new users actually created wallets and minted CUBEs, causing the chart for CUBE Mints and Unique Users to spike simultaneously. Like “Project A” in the earlier example, Mantle achieved high participation efficiency with a relatively small number of campaigns, which is why it continues to firmly hold the top spot in the Attention Index.
This calculation method for the Attention Index brings two key benefits:
Identifying cost-efficient projects: It highlights projects that manage to attract a large number of unique users through smaller-scale campaigns—projects that users genuinely find appealing.
Curbing abuse: Since the metric is based on unique participants rather than total participation count, it effectively filters out multi-account farming where numbers are artificially inflated using multiple wallets.
A high Attention Index, as seen with Project A or Mantle, signals that a project is capable of driving strong resonance and participation in the market with relatively little resource investment. Conversely, a low index, as in the case of Project B, indicates that despite heavy marketing spend, the actual user response fell short of expectations.
This approach creates a fair competitive environment where projects are judged not by scale or marketing budget but by idea and execution power. As a result, smaller projects with focused and creative campaigns can outperform large-scale, capital-heavy initiatives.
Source: Layer3 Signal
On the Layer3 Signal page, the Attention Index can be viewed at the level of blockchains, communities, and campaigns, across various time frames such as 24 hours, 7 days, 1 month, and 3 months. Shorter time frames are useful for capturing the latest trends but may miss the bigger picture, while longer time frames allow for stable analysis but are less sensitive to subtle changes. Therefore, combining multiple time perspectives is crucial for a comprehensive view.
2.3.1 Chain Distribution
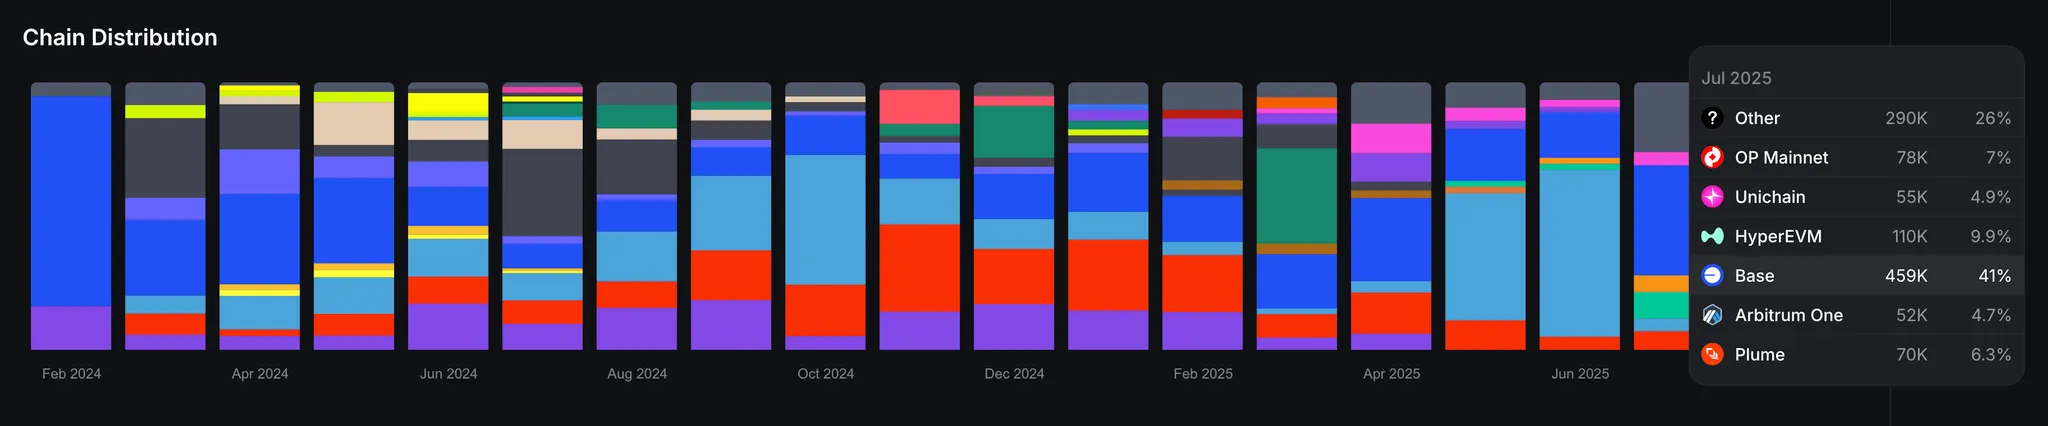
Source: Layer3 Signal
The Chain Distribution visually shows how all on-chain activity occurring on Layer3 is spread across multiple blockchain networks. In particular, it highlights the share of each blockchain—such as Arbitrum, Base, and others—allowing users to quickly identify which blockchain ecosystem is currently attracting the most attention and participation, and where market interest is flowing.
2.3.2 Cumulative Data
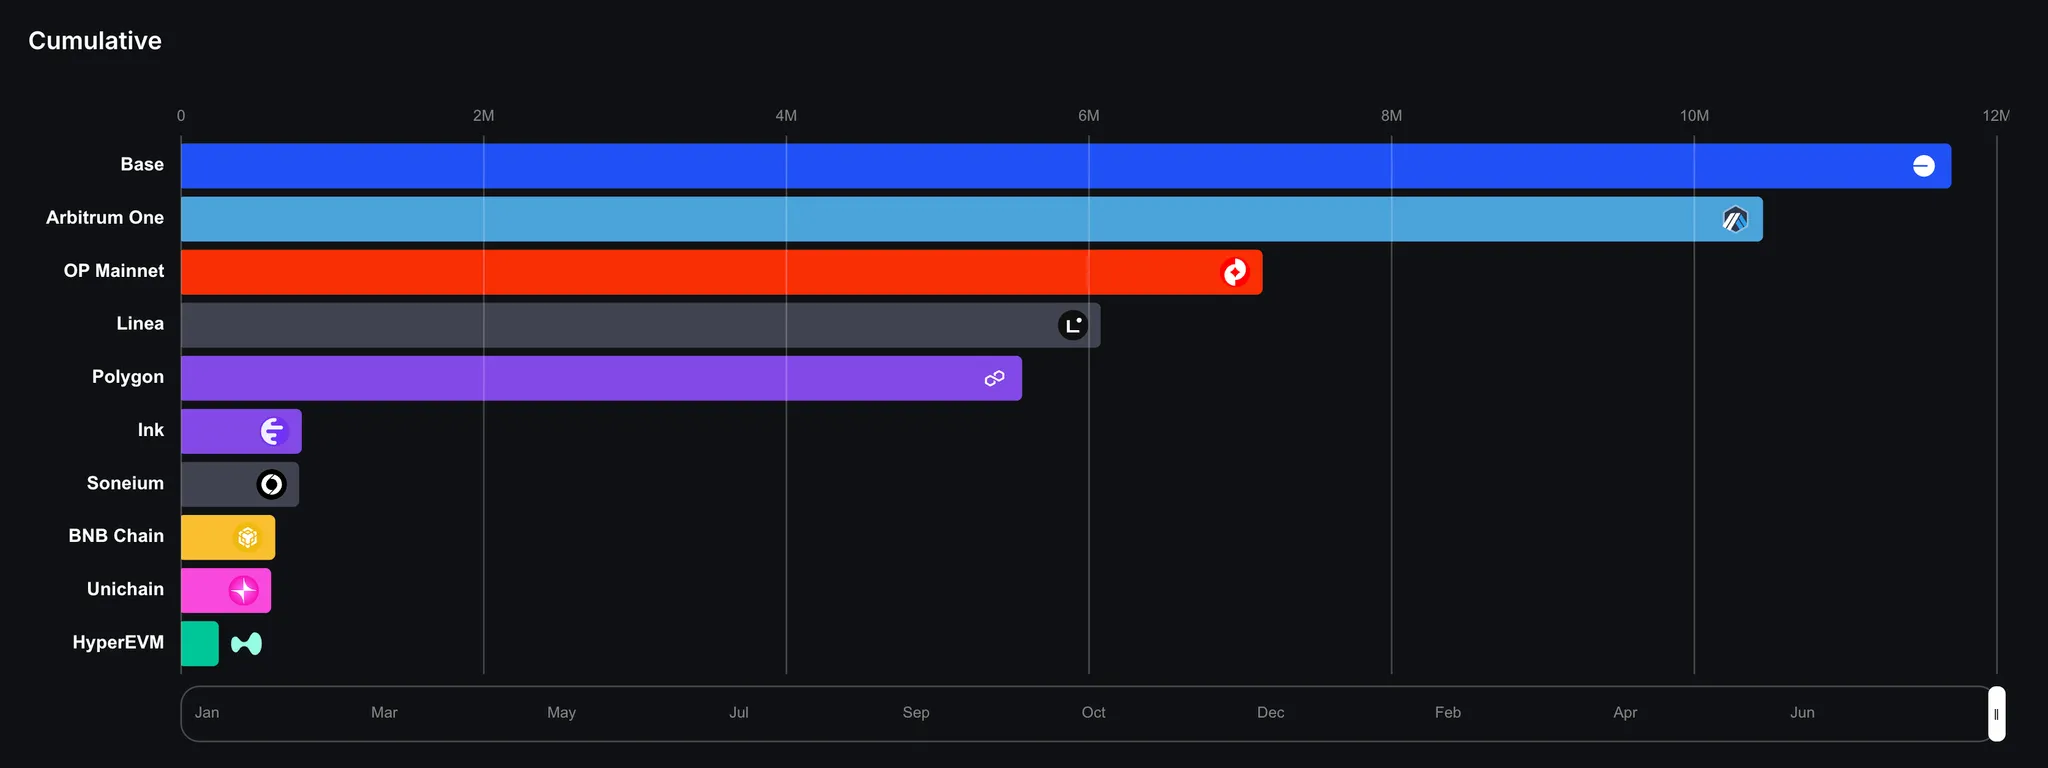
Source: Layer3 Signal
Cumulative Data represents the total number of on-chain activity metrics accumulated to date, showing how much activity each blockchain network has built up over time. This makes it possible to analyze from a macro perspective whether a blockchain is showing steady growth or experienced a sudden surge following specific events.
2.3.3 Total CUBEs
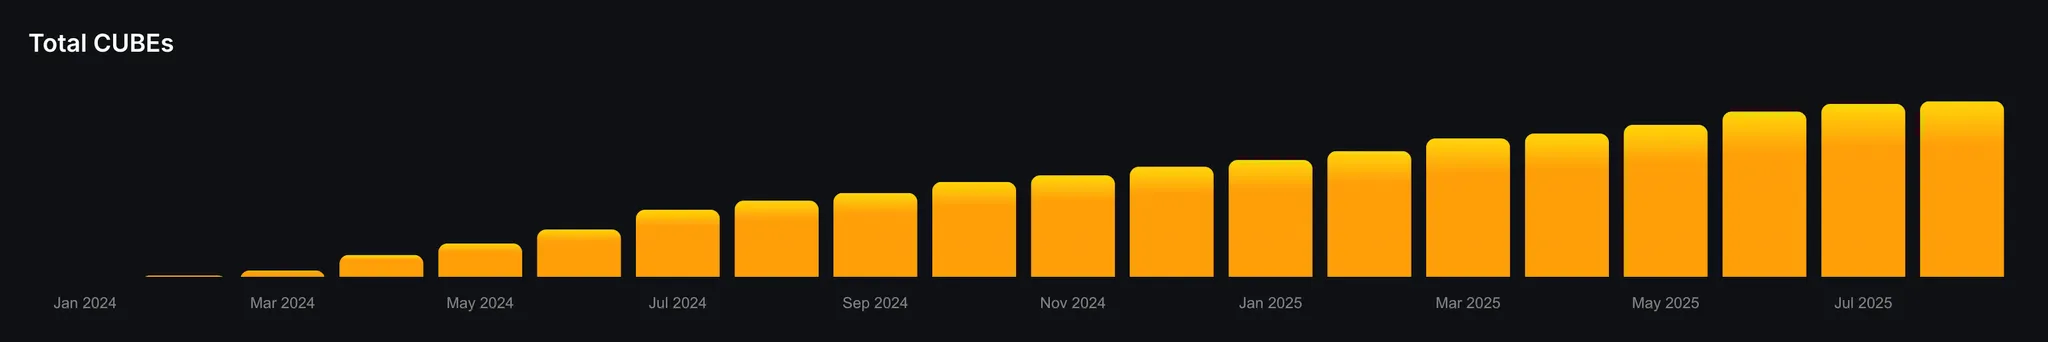
Source: Layer3 Signal
Total CUBEs represents the overall number of CUBEs issued since the launch of the Layer3 platform. Because a CUBE serves as proof that a user has completed a specific on-chain task, this figure directly reflects the scale of activity across the platform. In other words, it is the most intuitive measure of how many meaningful user interactions Layer3 has facilitated to date.
2.3.4 Onchain Attention Feed
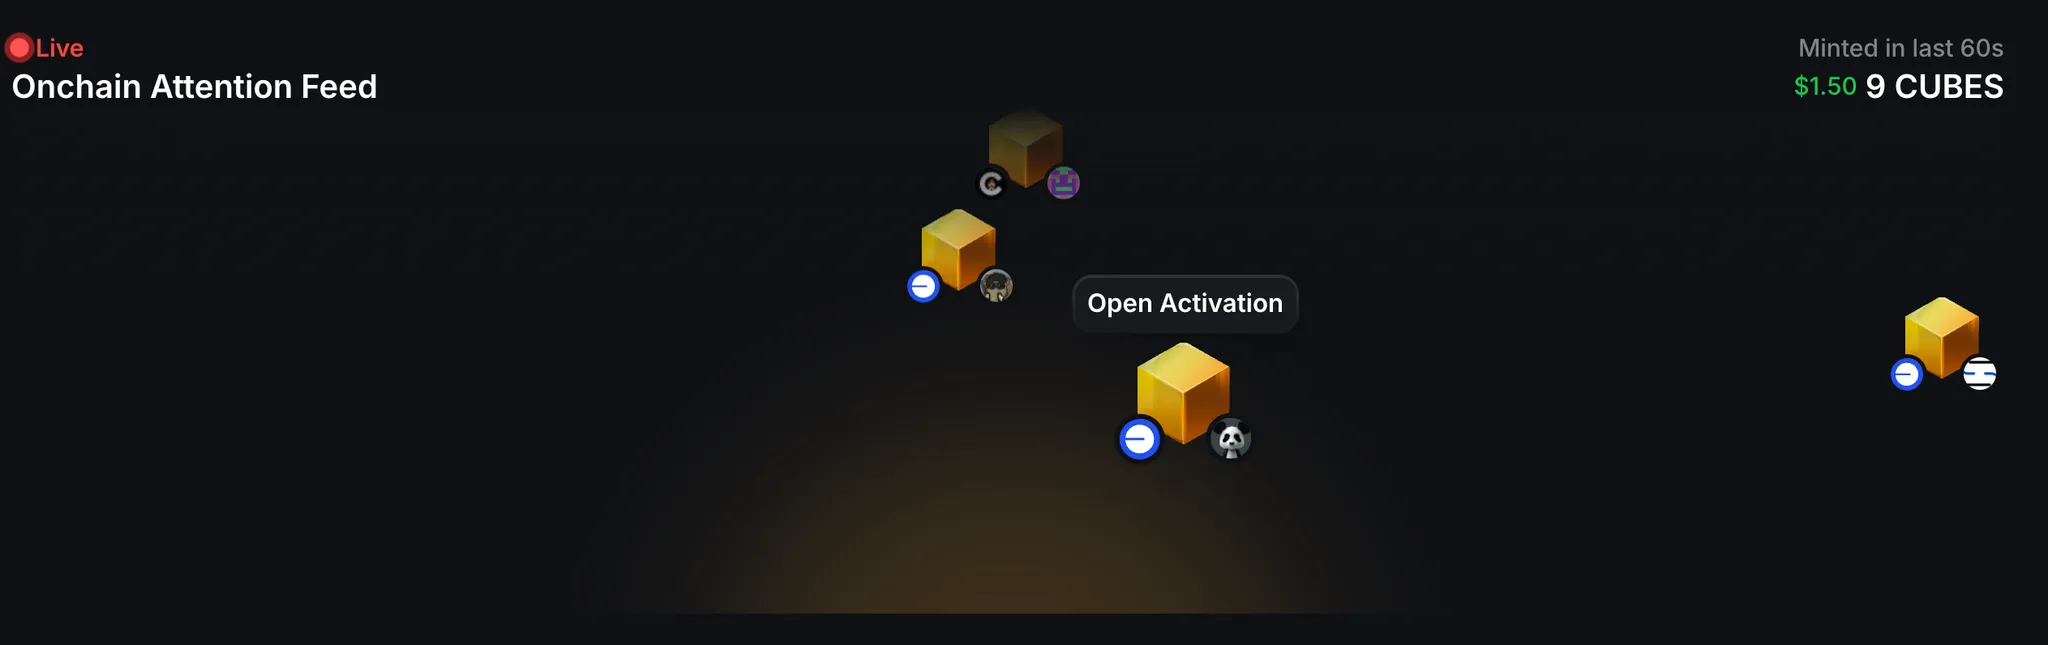
Source: Layer3 Signal
The Onchain Attention Feed is a log dashboard that displays user activity on Layer3 almost in real time. For example, it shows animated records such as “a wallet has just minted a CUBE through a specific campaign.” This delivers a live feed of what’s happening on the platform at that very moment. Moreover, clicking on a CUBE within the dashboard directs the user straight to the corresponding campaign where the CUBE was minted, allowing them to view more detailed information.
2.3.5 Trending Projects and Trending Chains
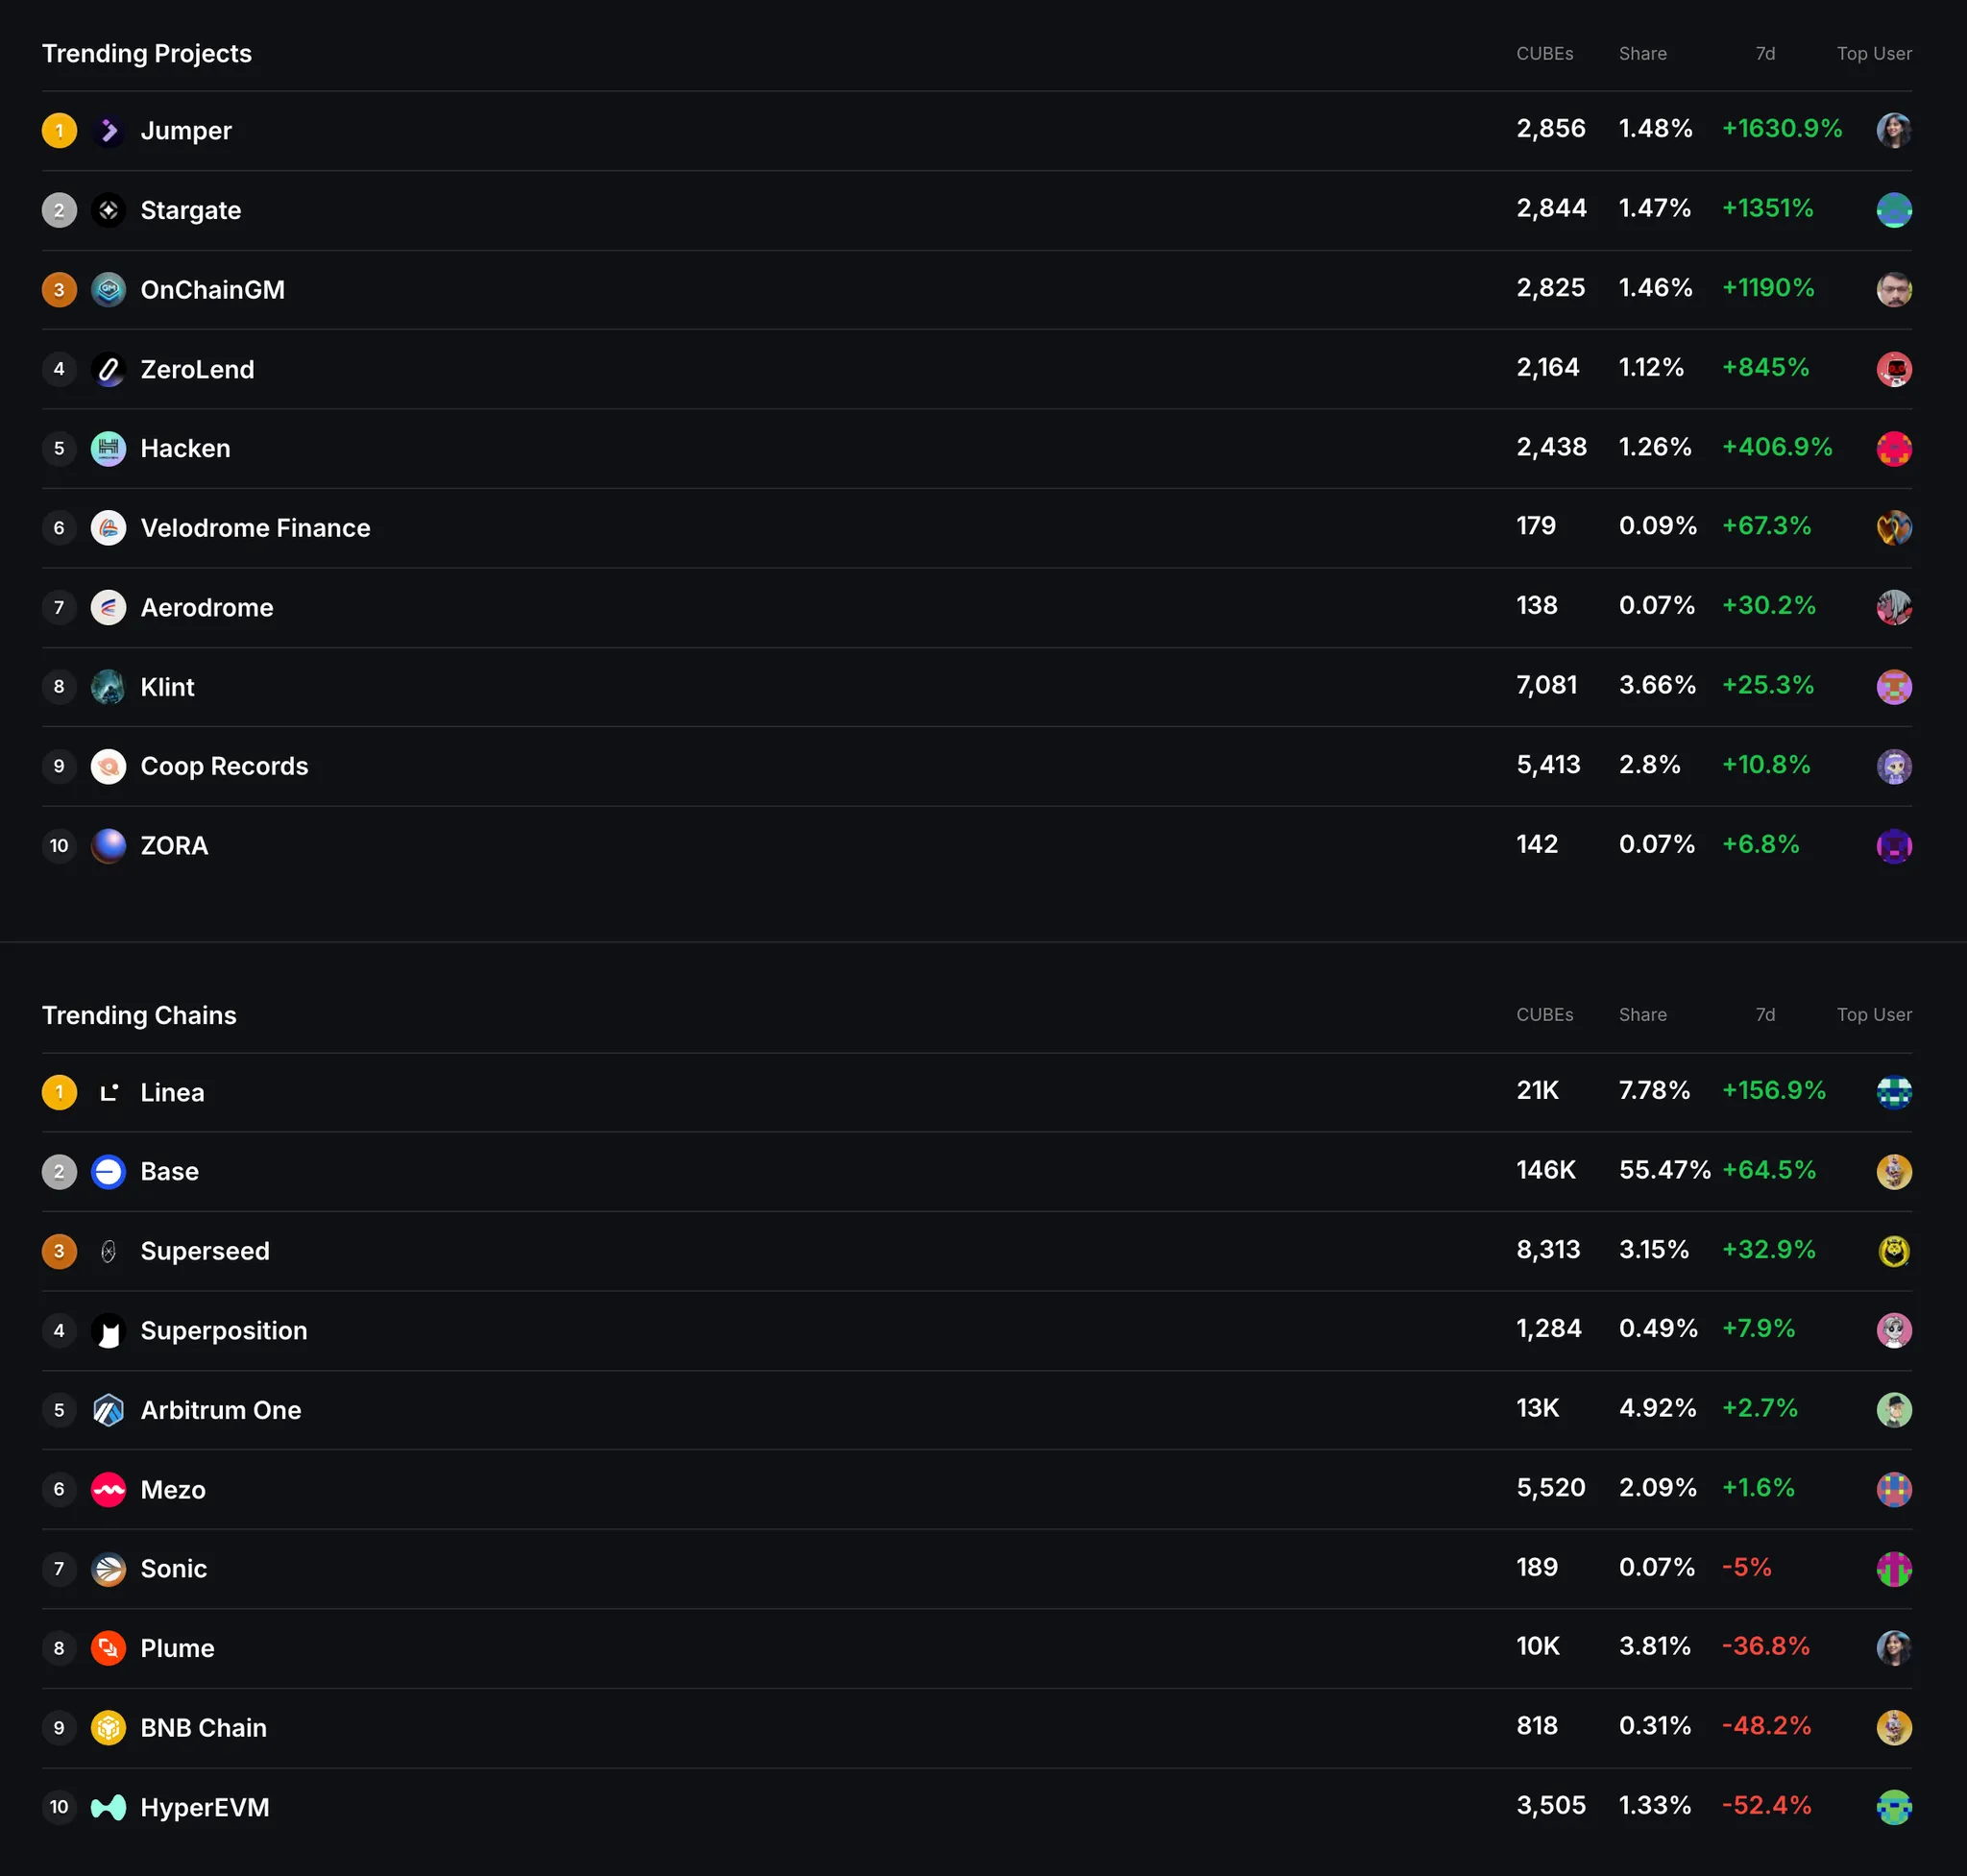
Source: Layer3 Signal
Trending Projects shows the ranking of projects whose CUBE minting volumes have rapidly increased over a recent period (7 days). This highlights not just large-scale projects, but specifically those that are experiencing an explosive surge in user interest at the moment. Investors and users can leverage this to identify new narratives and promising early-stage projects ahead of others.
Trending Chains, on the other hand, ranks blockchain networks that have recently seen sharp increases in user activity and participation. For example, if a major campaign is launched on a certain chain or a new killer app emerges that drives up CUBE minting, that chain’s ranking can rise dramatically. This allows users to see which Layer 1 or Layer 2 networks are currently drawing liquidity and attention, helping them anticipate which ecosystems to watch next.
So how can Signal’s metrics be effectively used? The value of Signal differs depending on the stakeholder. Exchanges, project teams, investors, and communities can all use Signal to cut through speculative noise and gain data-driven insights.
3.1.1 Exchanges: Discovering Potential Projects and Enhancing Listing Reviews
Both CEXs and DEXs can leverage Signal to identify projects that are showing user traction before token prices or trading volumes surge. For example, a project that newly enters the top rankings on Signal or shows simultaneous improvement in 7-day and 30-day metrics is a strong signal that market attention is converting into actual user activity. This can serve as a valuable reference when making decisions on listings or introducing liquidity pools. However, to avoid distortions caused by short-term incentive campaigns, it is important to cross-check with tools like Nansen or Artemis—looking at liquidity, stablecoin inflows, and net wallet growth.
3.1.2 Project Teams: Measuring and Optimizing Marketing ROI
For project teams, Signal acts as a direct measurement tool for marketing performance. By tracking changes in the Attention Index, teams can quantitatively analyze which messages, channels, rewards, or quest difficulties most efficiently drive user actions. For instance, chain-level A/B testing can measure the impact of gas fees or transaction speeds on conversion rates. This enables projects to optimize marketing budgets and adjust strategies based on concrete data.
3.1.3 Investors and VCs: Investing Based on Real Growth
VCs and individual investors can rely on the real usage intensity data provided by Signal, rather than depending on hype-driven social media activity or short-term price swings. If a project’s Attention Index steadily rises while on-chain liquidity indicators such as LP retention or TVL stability also improve, investors gain a far more precise basis for decision-making. This makes it possible to assess the intrinsic value of projects with genuine user bases and build portfolios with a long-term perspective.
3.1.4 Communities: A Tool to Prove Growth
For community members, Signal provides objective evidence supporting claims like, “Our project has effectively driven this level of on-chain participation.” Such data can be used as credible material when attracting new members or convincing potential partners. However, it is important to note that metrics may vary depending on campaign design. Presenting complementary data such as long-term user retention can further enhance credibility.
While Signal is a powerful tool for tracking project and blockchain trends based on on-chain data, there are several caveats to keep in mind when interpreting and applying its insights:
Selection Bias: Signal reflects only the activity that occurs within the Layer3 platform. Generalizing these results to represent the entire ecosystem carries risk, as relevance within Layer3 may not fully capture relevance across the broader Web3 landscape.
Design Sensitivity: Campaign design elements—such as quest difficulty or reward size—directly impact the Attention Index. When interpreting the metric, it’s important to account for whether short-term results were inflated by easy quests or disproportionately strong incentives.
Sybil Resistance: Signal defends against Sybil attacks by measuring unique participants, but sophisticated bots could still influence outcomes. Layer3 employs anti-abuse mechanisms, yet users of Signal’s metrics should remain aware of the potential for manipulation.
Cross-Chain Heterogeneity: Differences in fees, speed, and UX across chains affect user behavior. Therefore, when comparing Attention Index scores between projects on different chains, these environmental variations must be taken into account.
Layer3 plans to gradually evolve Signal into a more sophisticated premium model—this also represents a core part of its B2B business strategy.
3.3.1 Predictive Insights and Campaign Benchmarks
The paid version of Signal will introduce “Predictive Insights”, a feature that analyzes Attention Index trends in greater detail to identify projects with high growth potential. It will also include “Campaign Benchmarks”, enabling teams to compare their campaign performance against competitors or industry averages, as well as “Real-time Analytics” for responding quickly to fast-changing markets.
3.3.2 Expanding the Ecosystem Through Data APIs
Signal will provide API access so that data teams, funds, and external analytics platforms can directly leverage its data. By doing so, Signal won’t be limited to Layer3’s own tools and platform—instead, external developers will be able to build new analytics tools and investment strategies, expanding Signal into a broader data ecosystem.
3.3.3 Layer3’s Sustainable Revenue Model
Premium features and API services will form a new B2B revenue stream for Layer3, built on its proprietary on-chain data assets. This demonstrates Layer3’s shift from a B2C quest platform toward a diversified business model as a B2B and B2D (Business-to-Developer) data platform. Quest operation costs can be offset by data sales revenue, which in turn can be reinvested into quest development—creating a sustainable flywheel effect.
The emergence of Signal is not just the introduction of another analytics tool—it is significant because it brings a new perspective to how the crypto market interprets attention data and assigns value. Signal bridges the trade-off between speed and reliability by introducing a new criterion: “On-chain Participation Efficiency”.
The Attention Index, which embodies this criterion, has the potential to become a core KPI or even a standard metric for measuring real user participation in the crypto market—similar to Total Value Locked (TVL) in DeFi or Daily Active Users (DAU) in app services. However, several challenges remain before it can be established as a widely trusted industry benchmark:
Establishing a precise definition of “unique users” and developing robust logic to defend against Sybil attacks by non-unique users.
Expanding coverage beyond the Layer3 ecosystem to include a broad range of partners and chains, thereby improving representativeness.
Building a highly interoperable API ecosystem that can integrate with external analytics tools and datasets.
Providing project- and chain-level benchmark metrics to enable objective comparisons accessible to all.
Ultimately, Signal serves as a mirror for projects, investors, and communities alike—prompting reflection on whether the flood of information being generated is merely “noise” without substance, or a true “signal” that drives action. By attempting to quantify the intangible value of attention in a fair and meaningful way, Signal contributes to a cultural shift where projects are evaluated not by hype or speculative frenzy, but by actual usability and value.
This change is essential for the crypto market’s maturation. And if Layer3’s Signal successfully brings this perspective into the mainstream, we may be witnessing the birth of a critical standard on-chain metric for Web3.
Related Articles, News, Tweets etc. :
Dive into 'Narratives' that will be important in the next year